Improving the performance of the Facebook app for iOS has been an ongoing area of focus at Facebook. We believe that a performant app can help deliver an engaging and delightful experience. One thing that everyone who uses the Facebook app has to do, is launch it (we refer to this action as “app start”). Hence, it’s a good target for optimization.
Stable Metrics
The best performance metrics and corresponding goals motivate us to focus on the tasks that will have the greatest impact. A metric needs to be easy to understand and to reason about, and it needs to accurately capture the experience being optimized. For performance-based metrics, we’ve found that it’s best to use those that captured a perceived interaction when using the app. Ideally, such metrics would also have a one-to-one correspondence with a single execution path through the infrastructure. For app start, it was a challenge to identify the key places to measure. It took a few iterations to streamline our measurements and remove edge cases.
App start is actually a rather amorphous concept because there are many different ways an app can start. The app can start in the background or in the foreground, and it can even start in the background but be foregrounded before the initialization path completes. There are also multiple entry points into the app. You can launch it by tapping on a notification or by opening a URL that opens the app. The Facebook app can even be opened via another app so as to login with Facebook. In reality the major interaction is the most straightforward one: You tap the Facebook app’s icon on the home screen and jump right in. That’s the entry point we chose to measure.
With the entry point clear, we then had to figure out when app start was complete. Again we looked at the usage patterns and saw that in most cases people open the app (which goes to News Feed) and then wait for their feed to load. We decided that “feed finished loading” was a good endpoint for our measurement. It took some fine-tuning to make this endpoint align with the people’s perception. This alignment enabled us to build intuition around the metrics by repeatedly observing app starts ourselves.
Once we had entry points and endpoints that we felt were good representations, we broke down the problem into 2 types of starts:
- Cold start. This is when the application isn’t already running, and we must load and construct the entire application. This includes setting up the tab bar at the bottom of the screen, ensuring that a person is properly logged in, and quite a bit more. The “bootstrap” process is kicked off from the iOS
applicationDidFinishLaunching:withOptions:method. - Warm start. This is when the application was already running but was suspended in the background (which typically happens when a person presses the home button), and we simply need to pick up where we left off when the app entered the background. In this case, our app receives a foreground event via the
applicationWillEnterForeground:method, and the application resumes.
We decided to focus primarily on optimizing cold start. There were 2 reasons. First, it’s simply a superset of warm start (cold start initializes the app and fetches feed; warm start only fetches feed), so there are more areas to optimize and tweak. Second, cold start needs to do the extra initialization work, so it’s comparatively slower, resulting in longer wait times when starting the app.
Optimizing the Cold Start Experience
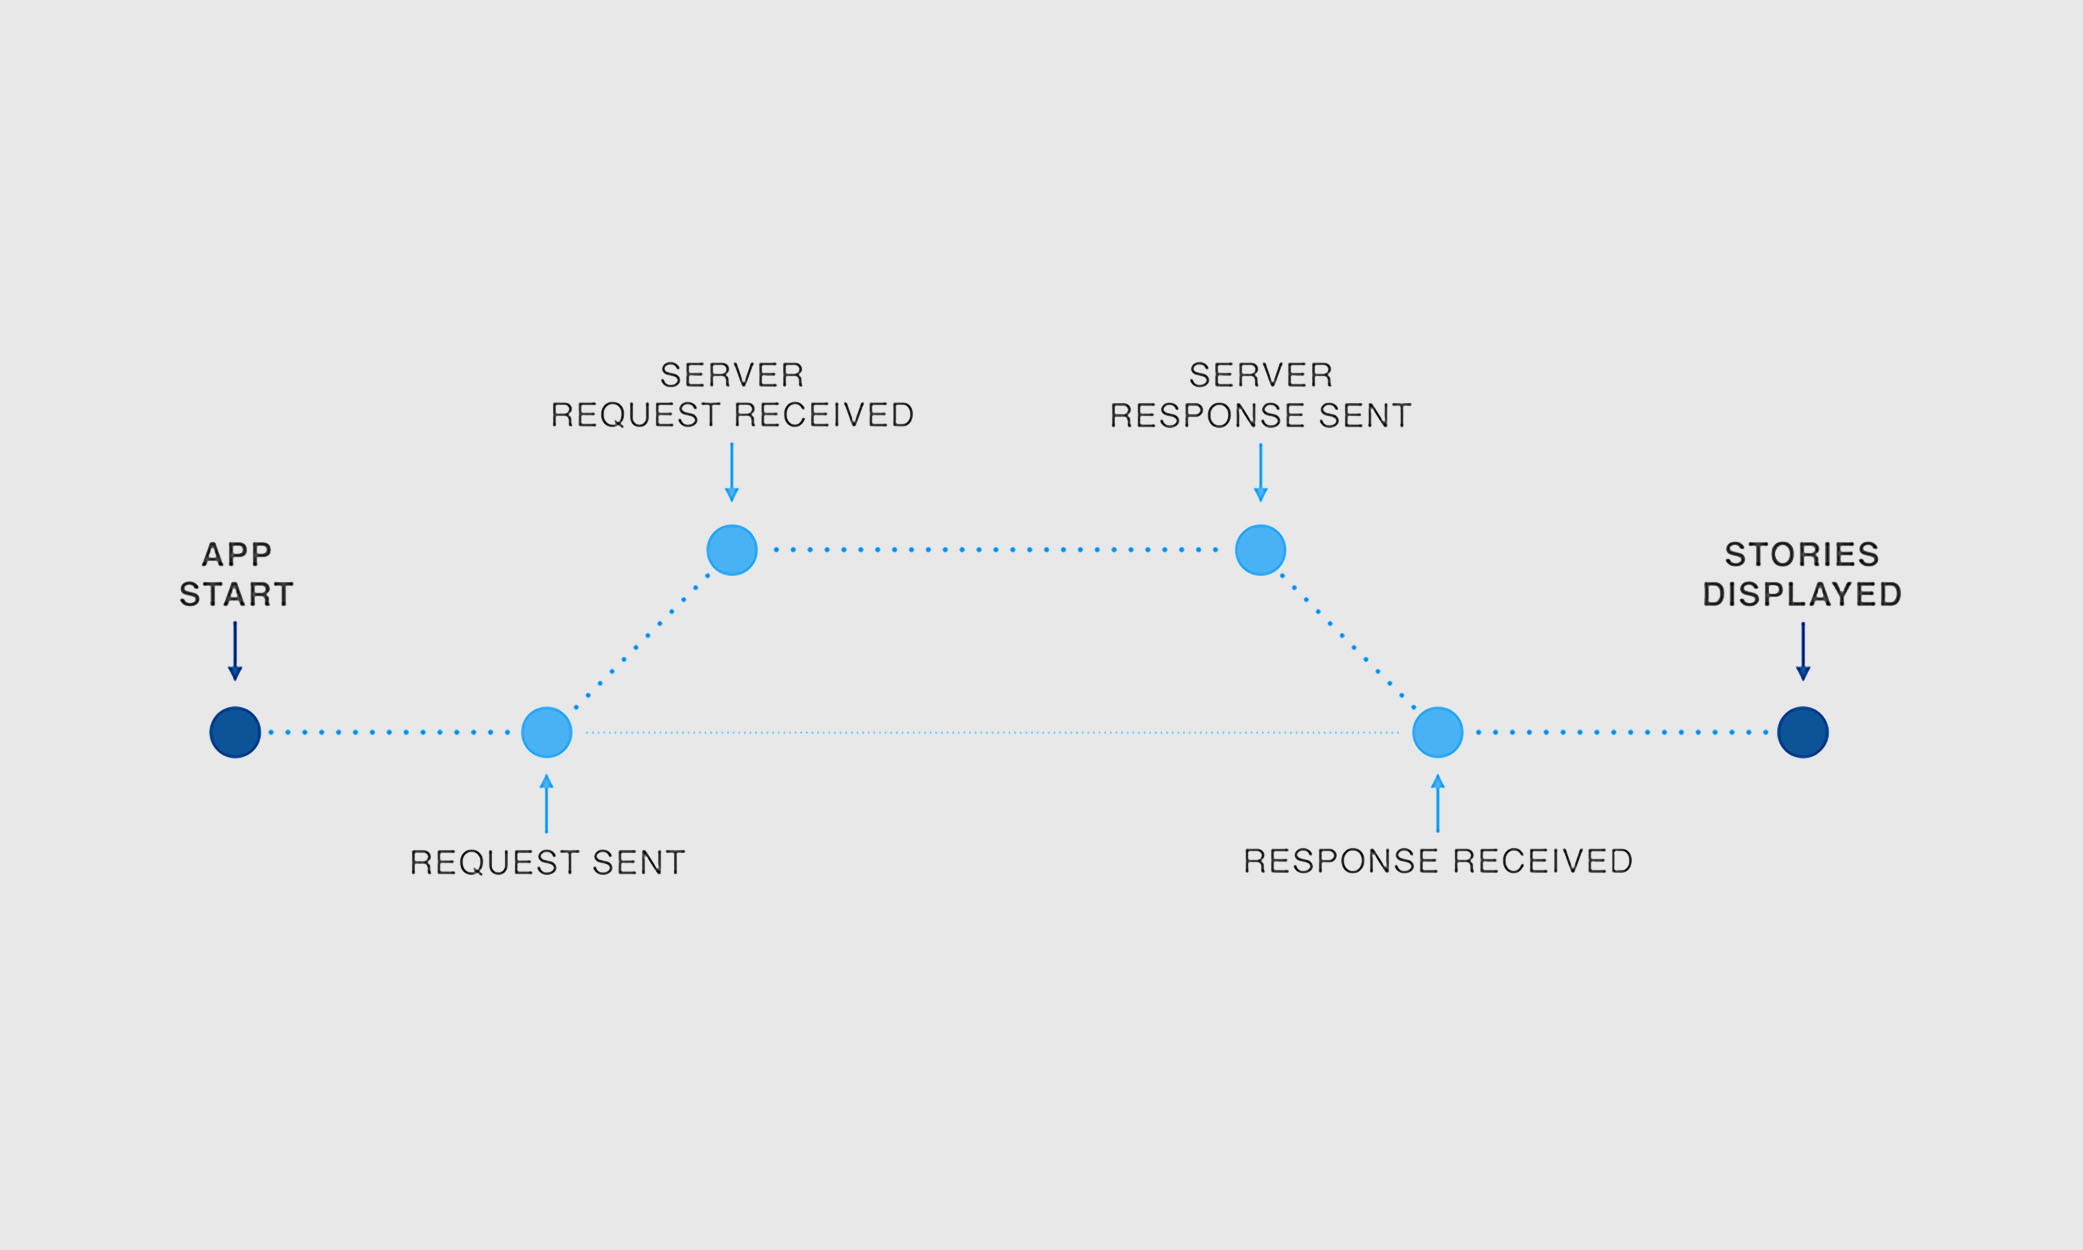
We broke the cold start problem into 3 stages that we could focus on individually. Each had its own set of variables and challenges.
- Request time: The time from the app starting to the feed request leaving the device.
- Network time: The time from the feed request leaving the device to the response coming back.
- Response processing time: The time from the response coming back to new stories being displayed onscreen.
Our instinct was that cold start was dominated by network and that the rest would be mostly response processing. This belief came from the assumption that we spent much less time on the client and that we managed to get the request out rather quickly. However, once we instrumented it, we found the data quite surprising. It presented a starkly different picture, with a significant portion of time spent before the feed request — on the order of a second. Also, the response processing time was very short. Hence, we refocused on optimizing the initialization phase.
Initialization to Feed Request Sent
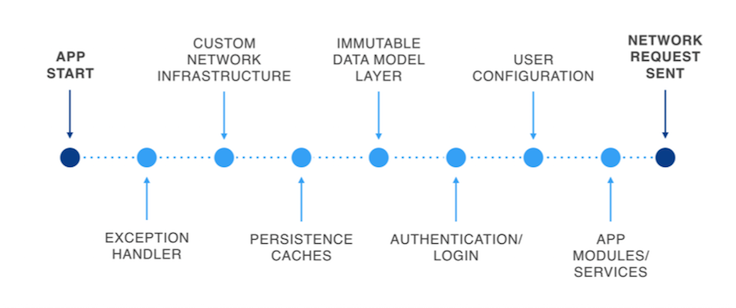
So why was this phase taking so much time? Most iOS applications don’t have such a problem — there’s little work to be done at that point, apart from initializing the view controllers and sending out the network requests. However, for Facebook, a significant amount of time spent on the start path went toward the setup of various pieces of infrastructure. Here’s an overview of the major components in our pipeline.

This might seem like a complex setup at start time. It’s important to note, however, that these pieces delivered crucial improvements to the Facebook app, enhancing the app experience and enabling engineers to move faster at scale.
As we focused on this pipeline, we got a few major wins by optimizing the individual parts. However, the wins were slowly offset by further initialization to support new features as well as additional infrastructure to support them. This made us reconsider how we were approaching the problem. As we stepped back, we figured that the objective for this phase was simply to send out the feed network request. But why was the feed request so late to get out? It was because many dependencies had been added to the initialization of the feed request over the years. However, they weren’t truly necessary — the bare minimum requirements for sending out the feed request were a valid authentication token and feed cursors (the location in News Feed). Hence, we whittled down the dependencies of the feed request, progressively moving it closer to the app’s launch. This allowed the rest of the app to initialize concurrently with the feed response. We achieved significant gains in perceived time due to the refactor.
Network and Server Time
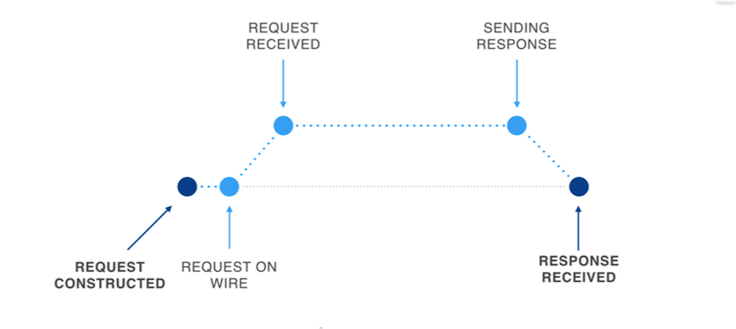
Based on our experience with the first phase, we continued breaking down this stage into smaller parts. The journey of a network request/response looks like this:

We noticed a lag while we sent out the request, once the request was enqueued. This one was easy to explain — at a cold start, there wasn’t an open, secure TCP connection. Setting one up takes 3 round-trips to the server, on the order of several hundred milliseconds on average. As the feed request is the first to be sent out, it has no choice but to incur this time. In the long term, this can be solved by caching the SSL certificates. But again, as we stepped back, our goal wasn’t really to send a TCP request at all; it was to get the request information to the server by whatever means possible.
We came up with a creative solution for this — UDP Priming. In essence, before we send out the feed request over TCP, we send an encrypted UDP packet to the server, containing the feed request. The purpose of doing this is to give a hint to the server to kick off fetching and caching of data much earlier. When the actual feed request arrives over TCP, the server can then simply construct the response from cached content and send it back. Enabling this technique allowed us to gain several hundred milliseconds more.
As we increased our focus on the server, we experimented with our story-fetching strategy. Historically, we had done a batch feed request of 3+7 stories. The reasoning behind it was simple: Download times were directly proportional to the number of stories being sent down. Hence, splitting the request into 2 chunks allowed the first 3 stories to come in first and the other 7 to come in later. With improvements to our infrastructure, we were instead able to move it to a 1+1+X strategy, which is closer to streaming. This reduced the amount of time the server had to spend to process the first story and also cut down on the time to download it, resulting in faster times to interaction for people. We cut another few hundred milliseconds by this effort.
Feed Response Processing
As mentioned before, this is where we expected a significant amount of time to be spent on app start. This intuition proved to be incorrect. More intriguing, we noticed, is that a majority of time wasn’t even being spent on processing and rendering the stories. Time was being taken by app services running and contending for resources. We noticed that this was a side effect of us having optimized the network plus server time, such that the feed request came back much earlier. Most of these services were noncritical, though. Hence, we developed a simple mechanism to enqueue all this work until app start completed, and then execute it in a first-in, first-out manner. This allowed the processing of all the stories with less contention, further reducing the amount of time between getting the response and showing it onscreen.
Conclusion
It’s hard to appreciate how far we’ve come in the past few months. In a side-by-side comparison, we found that our optimizations added up to a multi-second improvement.
Optimizing this particular interaction has been a long journey of building a stable metric, developing a strong understanding around the real-world performance characteristics of the metric and constantly rethinking the problem to arrive at innovative solutions. We hope it makes your experience of using Facebook a more delightful one.
You can also check out Greg Moeck’s talk at @Scale 2015.
Special thanks to Greg Moeck, Mike Magruder, Oliver Clark Rickard, Marty Greenia, Adam Ernst, Ari Grant, Linji Yang, Ben Green, Slobodan Predolac, Cloud Xu, Eunchang Lee and Jiayi Zhu, all of whom made significant contributions to the effort.


