Memory on mobile devices is a shared resource. Apps that manage it improperly run out of memory, crash, and suffer from drastically decreased performance.
Facebook for iOS has many features that all share the same memory space. If any specific feature starts consuming too much memory, it can affect the whole app. This happens, for example, if a feature accidentally introduces a memory leak.
Memory leaks happen when we allocate a given portion of our memory to a set of objects and forget to free it after we're done using them. This means that the system can never reclaim the memory and use it for something else, which eventually means we'll run out of available memory.
At Facebook we have many engineers working in different parts of our codebase. It's inevitable that memory leaks will happen, and when they do, we need to quickly find them and fix them.
Some tools already exist to find leaks, but they require a lot of manual intervention:
- Open Xcode and build for profiling.
- Launch Instruments.
- Use the app, trying to reproduce as many scenarios and behaviors as possible.
- Watch for leaks/memory spikes.
- Hunt down the source of the memory leaks.
- Fix the problem.
This means a lot of manual work that has to be repeated every time. Because of that, we might not be able to locate and fix memory leaks early in our development cycle.
Automating this process would allow us to find memory leaks faster without much developer involvement. To address that issue, we have built a suite of tools that allow us to automate the process and fix a number of problems in our own codebase. Today, we are excited to announce that we are releasing these tools: FBRetainCycleDetector, FBAllocationTracker, and FBMemoryProfiler.
Retain cycles
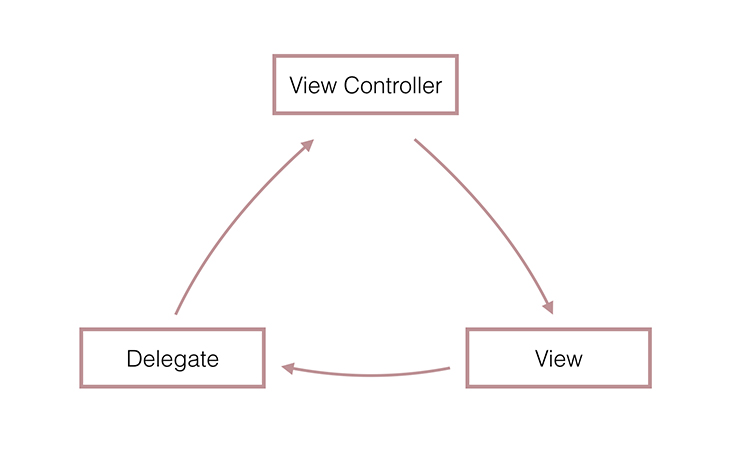
Objective-C uses reference counting to manage memory and release unused objects. Any object in memory can "retain" another object, which keeps the other object in memory as long as the first object needs it. One way of looking at this is that objects "own" other objects.
This works well most of the time, but we reach an impasse when two objects end up "owning" each other, either directly or, more commonly, indirectly via objects connecting them. This cycle of owning references is called a retain cycle.

Retain cycles can cause a range of problems. At best it wastes only a little bit of memory if the objects are taking up space in RAM indefinitely. If the leaked objects are actively doing nontrivial things, less memory is available to other parts of the app. At worst, the app can crash if the leaks cause it to use more memory than is available.
During manual profiling we have found out we tend to have plenty of retain cycles. It's easy to introduce them, and can be hard to find them later on. Retain Cycle Detector makes it easy to find them.
Retain cycle detection at runtime
Finding retain cycles in Objective-C is analogous to finding cycles in a directed acyclic graph in which nodes are objects and edges are references between objects (so if object A retains object B, there exists reference from A to B). Our Objective-C objects are already in our graph; all we have to do is traverse it with a depth-first search.
It's a very simple abstraction that works really well. We have to make sure that we can use objects like nodes, and that for every object, we can get all objects it references. These references can be either weak or strong. Retain cycles are caused by strong references only. For every object, we need to figure out how to find only those references.
Fortunately, Objective-C offers a powerful, introspective, runtime library that can give us enough data to dig into the graph.
A node in the graph can be either an object or a block. Let's discuss traversing them separately.
Objects
The runtime has a lot of tools that allow us to introspect objects and learn a lot about them.
The first thing we can do is grab the layout of all an object's instance variables (the “ivar layout”).
    const char *class_getIvarLayout(Class cls);
    const char *class_getWeakIvarLayout(Class cls);
For a given object, an ivar layout describes where we should look for other objects that it references. It will provide us with an “index,” which represents an offset we have to add to the object address in order to get the address of an object it references. What runtime also lets us do is grab a “weak ivar layout,” which is a layout of all weak instance variables of that object. We can assume that the difference between these two layouts will be a strong layout.
There is also partial support for Objective-C++. In Objective-C++ we can define objects in structs, and those will not be fetched in an ivar layout. Runtime offers “type encoding” to deal with this. For every instance variable, the type encoding describes how the variable is structured. If it's a struct, it describes what fields and types it comprises. We parse the type encoding to find which instance variables are Objective-C objects. We calculate their offsets for them and, as in layouts, grab the addresses of the objects they point to.
There are also some edge cases we won't go into deeply. These are mostly collections that act differently, and we have to actually enumerate through them to get their retained objects, which potentially could have some side effects.
Blocks
Blocks are a little bit different than objects. The runtime does not let us easily look at their layout, but we can still play a guessing game.
In dealing with blocks, we have used the idea presented by Mike Ash in his project Circle: the project that inspired FBRetainCycleDetector in the first place.
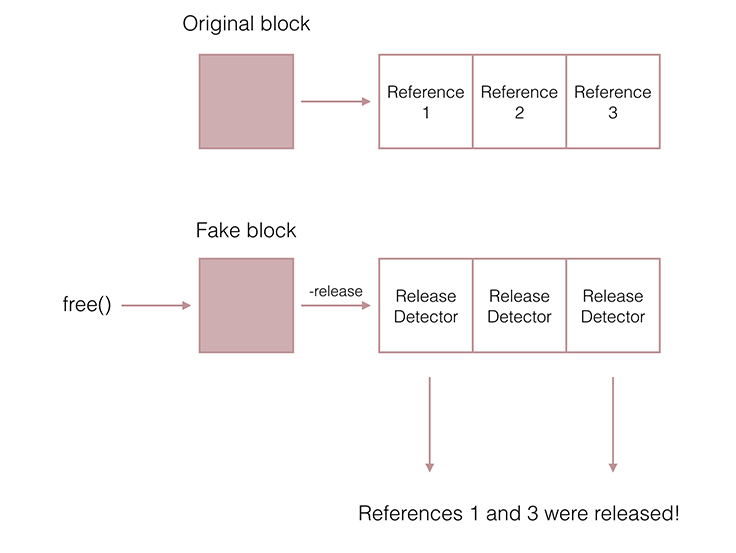
What we can use is application binary interface for blocks (ABI). It describes how the block will look in memory. If we know that the reference we are dealing with is a block, we can cast it on a fake structure that imitates a block. After casting the block to a C-struct we know where objects retained by the block are kept. We don't know, unfortunately, if those references are strong or weak.
To do that we are using a blackbox technique. We create an object that pretends to be a block we want to investigate. Because we know the block’s interface, we know where to look for references this block holds. In place of those references our fake object will have “release detectors.” Release detectors are small objects that are observing release messages sent to them. These messages are sent to strong references when an owner wants to relinquish ownership. We can check which detectors received such a message when we deallocate our fake object. Knowing which indexes said detectors are in the fake object, we can find actual objects that are owned by our original block.

Automation
The tool really shines when it's run continuously and automatically on employees' internal builds.
Automating the client side part is simple. We install Retain Cycle Detector on a timer and periodically scan a portion of memory to find retain cycles. It wasn't entirely without hiccups, though. The first time we ran the detector, we realized it could not traverse the whole memory space fast enough. We needed to provide it with a set of candidate objects from which it will start detection.
To do that efficiently, we built FBAllocationTracker. It's the tool that proactively tracks all allocations and deallocations of any subclasses of NSObject. It can quickly fetch any instances of any classes at any given moment with minimal performance overhead.
Having that automation on the client side means simply using FBRetainCycleDetector on an NSTimer, with the addition of grabbing instances we want to inspect with FBAllocationTracker.
Now let's take a close look at what happens on the backend.
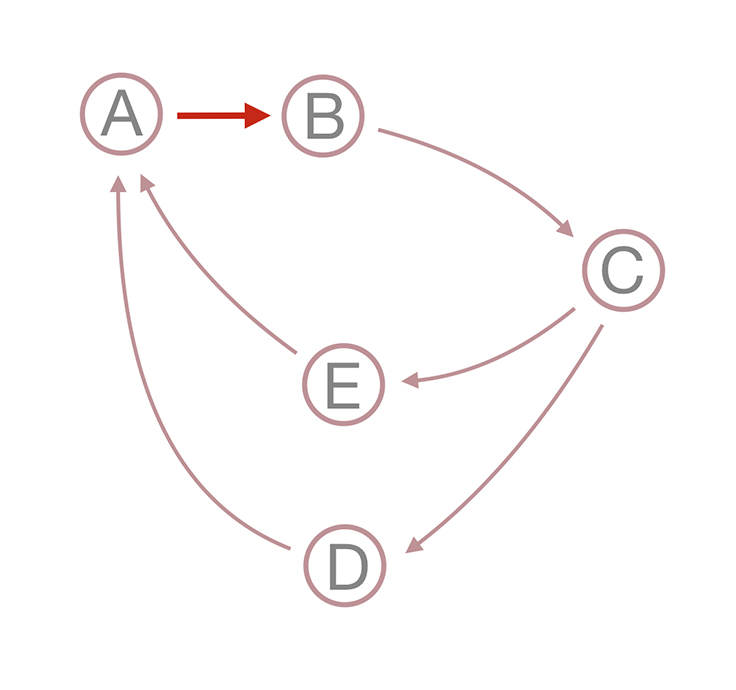
Retain cycles can consist of any number of objects. Things get a lot more complex when many cycles are created because of one bad link:

This forms two problems:
- We do not want to flag two retain cycles separately if they are caused by the same bad link.
- We do not want to flag two retain cycles together if they could possibly represent two problems, even if they share a link.
So we need to define clusters for retain cycles. We wrote an algorithm to find these that uses these heuristics:
- Gather all cycles detected on a given day.
- For each cycle, extract Facebook-specific class names.
- For each cycle, find the minimal cycle that has been reported and is contained in this cycle.
- Add every cycle to a group represented by the minimal cycle described above.
- Report minimal cycles only.
Having that, the last part is to find out who could have accidentally introduced a retain cycle in the first place. We do that by doing 'git/hg blame' on parts of code from cycle and guessing that it's probably the most recent change that could have caused the problem. That person who last touched the code receives a task asking to fix the problem.
The whole system can be visualized as follows:

Manual profiling
While automation helps simplify the process of finding retain cycles and reduces developer overhead, manual profiling still has its place. Another tool we built allows anyone to look at the memory usage of an app without even having to plug his or her phone into a computer.
FBMemoryProfiler can easily be added into any app and lets you manually profile your builds and run retain cycle detection inside the app. It does that by leveraging both FBAllocationTracker and FBRetainCycleDetector.
Generations
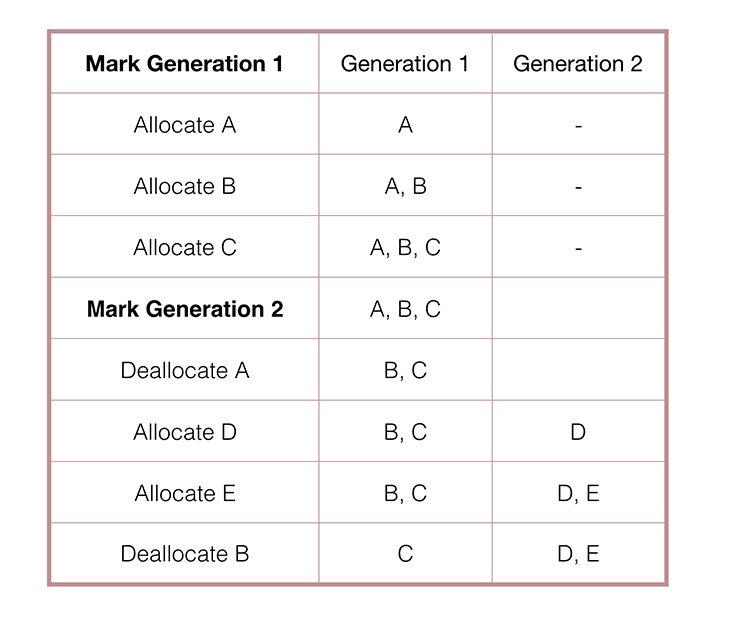
One of the great features that FBMemoryProfiler offers is “generation tracking,” similar to generation tracking in Apple's Instruments. Generations are simply snapshots of all living objects that were allocated between two time markers.
Using the UI of FBMemoryProfiler, we can mark a generation and, for example, allocate three objects. Then we mark another generation and continue allocating objects. The first generation contains our first three objects. If any object is deallocated, it is removed from our second generation.

Generation tracking is useful when we have a repetitive task that we think might be leaking memory, for example, navigating in and out of a View Controller. We mark a generation every time we start our task, and then investigate what is left over in each generation. If an object lives on longer than it should, we can see it clearly in the FBMemoryProfiler UI.
Check them out
Whether your app is big or small, has many different features or just a few, good memory management is good engineering hygiene. With these tools, we've been able to find and fix memory leaks much more easily, so we can spend less time on manual processes and more time on writing better code. We hope you find them useful, too. Check them out now on GitHub: FBRetainCycleDetector, FBAllocationTracker, and FBMemoryProfiler.


