Part of moving fast at Facebook means investing in good tooling. At our scale, we aim to have tools that let engineers not only quickly discover problems and fix them, but also help model behavior to move efficiently through a large code base. Lack of a solution for this need led us, like a lot of other Android developers, to a fair number of inconsistently maintained internal UIs, circumstantial and hard-to-interpret Log statements, not to mention many painful sessions with the Java debugger.
We think there is a better way
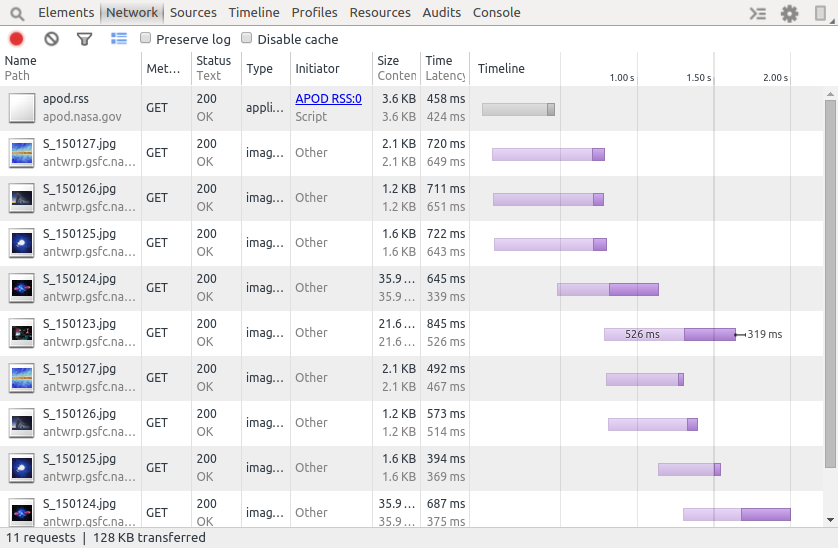
It’s hard not to look longingly at the fine state of tools available for web developers, particularly the Chrome Developer Tools suite. This conveniently integrated tool is accessible with a quick keyboard shortcut and offers rich visualizations that benefit from deep integration with the browser core.
But what about Android? Today, we’re open-sourcing a powerful new debugging platform for Android called Stetho. With it, developers can unlock much richer and more convenient access to data. And the best part: We use Chrome Developer Tools to serve the UI!

How does the integration work?
The common case requires very little work for developers. Simply link in the Stetho library and one of the network helpers (stetho-okhttp or stetho-urlconnection), and then modify Application.onCreate as such:
  public class MyApplication extends Application {
    public void onCreate() {
      super.onCreate();
      Stetho.initialize(
        Stetho.newInitializerBuilder(this)
          .enableDumpapp(Stetho.defaultDumperPluginsProvider(this))
          .enableWebKitInspector(Stetho.defaultInspectorModulesProvider(this))
          .build());
    }
  }
And teach your network library about Stetho:
OkHttpClient client = new OkHttpClient();
client.networkInterceptors().add(new StethoInterceptor());
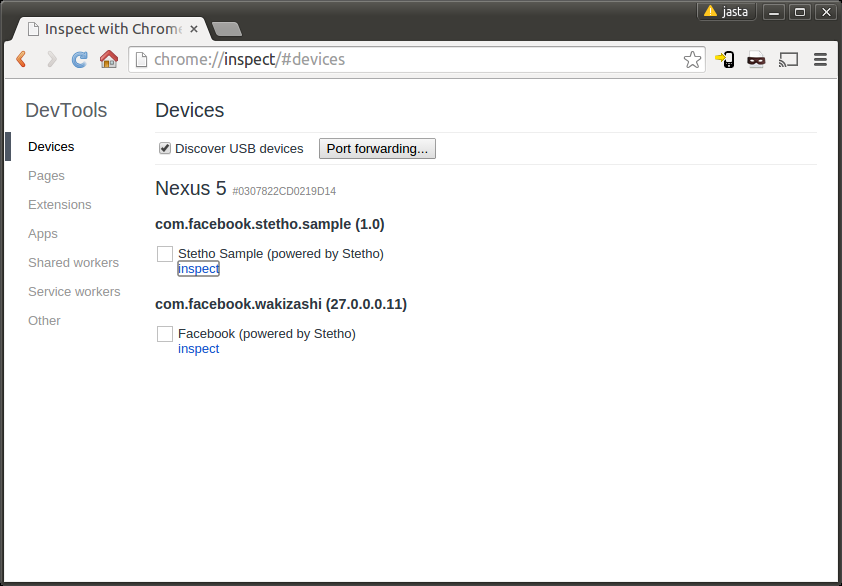
Now you’re ready to rock! Simply connect your phone, start your application, and navigate to chrome://inspect on your development machine:

To learn more, head on over to our GitHub page.
But wait, there’s more!
The Chrome Developer Tools UI is no doubt comprehensive, but there are, of course, parts of any nontrivial app that won’t be covered. Android offers a little-known extensibility point in the often-overlooked dumpsys tool, but with some major caveats. While it is possible to add custom debug code to any Android component (see Activity#dump, Service#dump, etc.) and access this debugging by invoking:
 adb shell dumpsys activity top
 adb shell dumpsys activity service com.yourpackage
Many problems still exist with this customized approach. For instance, perhaps you simply want a more convenient way to tweak internal settings stored in SharedPreferences. Developing custom internal settings screens are cumbersome, frustrating to maintain, and at a large scale can become increasingly inconvenient to use. Starting a service just to edit this data feels like overkill. How can we improve this?
Stetho to the rescue once more! With the optional dumpapp feature, you can easily embed main(String[])-like methods within your app to instrument any custom component. These micro programs address many of the problems with Android’s #dump methods by offering a convenient, extensible, and scriptable command-line environment. To get started, type:
  export PATH=”$PATH:/path/to/stetho/scripts”
  dumpapp --help
See stetho-sample to test-drive the standard plug-ins or to learn how you can write your own.
The best is yet to come
We are releasing early with a few features still missing, but we are hard at work on expanding the library. Stetho is our first Android open source project in 2015, and we are excited to get early feedback on our GitHub page (https://github.com/facebook/stetho).
We are looking forward to a great year — with a few more open source Android projects already in the pipeline. Stay tuned.
Happy hacking!


