
Key Takeways:
- With billions of Android app users, we’re always looking to improve the Meta app experience, and in this post, we explore the ways we’ve leveraged Android’s Baseline Profiles to significantly improve their performance.
- We discuss the performance challenges we’ve faced as Meta’s apps, how the needs of users have become more complex over time, and the infrastructure we’ve created to solve them.
- We share our insights on creating Baseline Profiles with user data and the tuning we’ve used to make them even more effective. Altogether, Baseline Profiles have improved performance for various critical metrics by up to 40% across Meta’s apps.
Application performance is critical for a good user experience. Slow startups, dropped frames and poor responsiveness are all key drivers of user frustration and, ultimately, attrition.
Performance consciousness during application development, and use of appropriate data structures, algorithms, caching strategies, and so on, are fundamental parts of mitigating these issues. However, it is equally important to understand the underlying representations of compiled application code, and the manner in which it is loaded and executed, such that build tools and runtimes can be configured and tuned optimally.
Over the past few years at Meta, we have developed infrastructure for profile-guided compiler and runtime optimizations targeting our Android applications. A major component of this infrastructure is the Android Runtime’s Baseline Profiles feature, which we have leveraged extensively to significantly improve the performance of our Android applications.
In this post, we’ll describe some performance considerations related to the Android Runtime (ART), explore some related performance challenges we have faced in our apps, and explain how we utilized Baseline Profiles to overcome them.
ART Performance Considerations
On Android, the preferred, and thus dominant, languages for user application development are Kotlin and Java. Kotlin/Java code is compiled to Dalvik bytecode (“Dex code”) and packaged into “.dex” files, which are organized into classes and methods reflecting their original sources.
Before any dex code associated with a method can be executed by the Android Runtime, its parent class must be loaded by the runtime. This happens when a class is first accessed during application execution, and involves locating the class’ metadata, registering it with ART, initializing static data, and anything else required to interact with the class.
Once its parent class is loaded, its methods may be executed. Dex code is, of course, not machine code that can be directly executed on hardware, and thus the Android Runtime must perform this translation. By default, at runtime, methods in dex code will simultaneously be executed via interpretation and profiled to determine if they are hot. Once a method is determined to be hot, it is compiled to machine code via ART’s just-in-time compiler, and the compiled version is executed thereafter. (Executing machine code is generally significantly faster than interpretation.)
Both class loads and the interpretation/profiling stage of dex method execution have runtime cost, which often result in temporary, but user-perceptible, performance degradation. Furthermore, classes must be re-loaded following every app cold start. Cold starts happen when the system starts the app for the first time. After a cold start, the app is in memory, and subsequent starts are much faster. (Note that this is somewhat mitigated by “runtime app images” on Android 14+.) ART does have a means of persisting compiled methods across cold starts (this is simplified—they are not strictly “persisted,” and require a background dexopt run between cold starts), but they must be re-profiled and re-compiled following an app version update.
Meta’s Mobile App Challenges
Meta’s mobile applications are the primary point of access for most of our users, the majority of which use Android. Our mobile apps face several challenges in balancing shipping velocity with our performance goals. Startup performance, in particular, is especially important, as it can have a disproportionate impact on user experience.
Maintaining a minimal set of classes loaded on startup is a key focus for startup performance. As our apps continue to add new features, such as Instagram Reels or Messenger’s End-to-End Encryption, the startup classes set grows as well. Besides user-visible features, critical functionality such as crash reporting, login authentication, and performance logging are all involved in startup. Facebook and Instagram, for example, each load more than 20,000 classes on startup, and several thousand more for feed scrolling.
We also care about improving performance for user journeys after startup. These user journeys measure key parts of the user experience, such as scrolling the user’s feed, or the time it takes to fetch and render a photo. Additionally, these journeys typically specify both the user’s behavior, such as scrolling or navigating, as well as where it’s happening. For example, a user scrolling their feed is considered separately from scrolling their inbox, and navigating to a profile is considered separately from navigating to a feed. We prioritize optimizing different user journeys for each app, and regularly revisit whether new ones should be added, or existing ones removed.
Optimizing user journeys requires understanding exactly what classes get loaded. For this, we collect profiles of class load sequences from many different users, and look for what they have in common. We’ve found that these profiles can look dramatically different across different users, even for the same user journey. Moreover, the exact same user can still have a different profile of class loads on another day, with different code paths taken due to experimentation, and can be different again the next week, as both the code and user behavior changes. Our monorepo sees thousands of commits each day. There is no easy one-size-fits-all solution here.
In total, we have a large, growing, and dynamic set of code to manage. We need a solution that can intelligently adapt to frequent code changes between each release, can quickly generate compiled code and profiles, and can benefit both startup and other user journeys.
ART Install-Time Optimizations
Since Android 9, ART has offered the following install-time optimizations:
- AOT (“Ahead of Time”) compilation of specified methods
- Creation of an “app image” with specified classes
AOT compilation means that specified methods will be compiled to machine code by ART before the app runs for the first time. This eliminates the overhead involved in interpreting and profiling the method’s initial execution.
An app image is a file containing a partial representation of the in-memory ART data structures, which would be created or populated by class loads for specified classes. When an app is started with an app image, it is mapped into the process’ heap, and any necessary fixups are applied. The end result is that many classes may be effectively loaded extremely quickly at startup, and any later runtime cost associated with loading these classes is eliminated.
These optimizations can be triggered by supplying a special profile to ART at app install time. There are two main mechanisms for this: Cloud Profiles and Baseline Profiles.
Cloud Profiles
Cloud Profiles are aggregations of profiling data from many different users collected by Google Play during the initial rollout of an app version. After the Cloud Profile has been created, all subsequent users installing that app version via Google Play will receive that Cloud Profile, which will be used by ART for AOT compilation and app image creation.
Cloud Profiles have several downsides, however:
- Earlier users in the rollout do not benefit at all from Cloud Profiles, as they’re the ones providing the profiling data.
- App developers do not have any way to observe or control the classes and methods in the profile.
- They are generated in a way that is strongly skewed towards early startup improvement.
- They are only available via Google Play—applications installed through other means such as different app stores or sideloading can’t use them.
Baseline Profiles
Baseline Profiles are similar to Cloud Profiles, as they also trigger ART install-time optimizations, with a few key differences. Whereas Cloud Profiles are generated by Google Play through collecting and aggregating data from early users of an app version, Baseline Profiles are generated and provided by application developers. Developers can simply package their Baseline Profile inside their corresponding APK or AAB. When both Cloud Profiles and Baseline Profiles are available, they can be used in tandem.
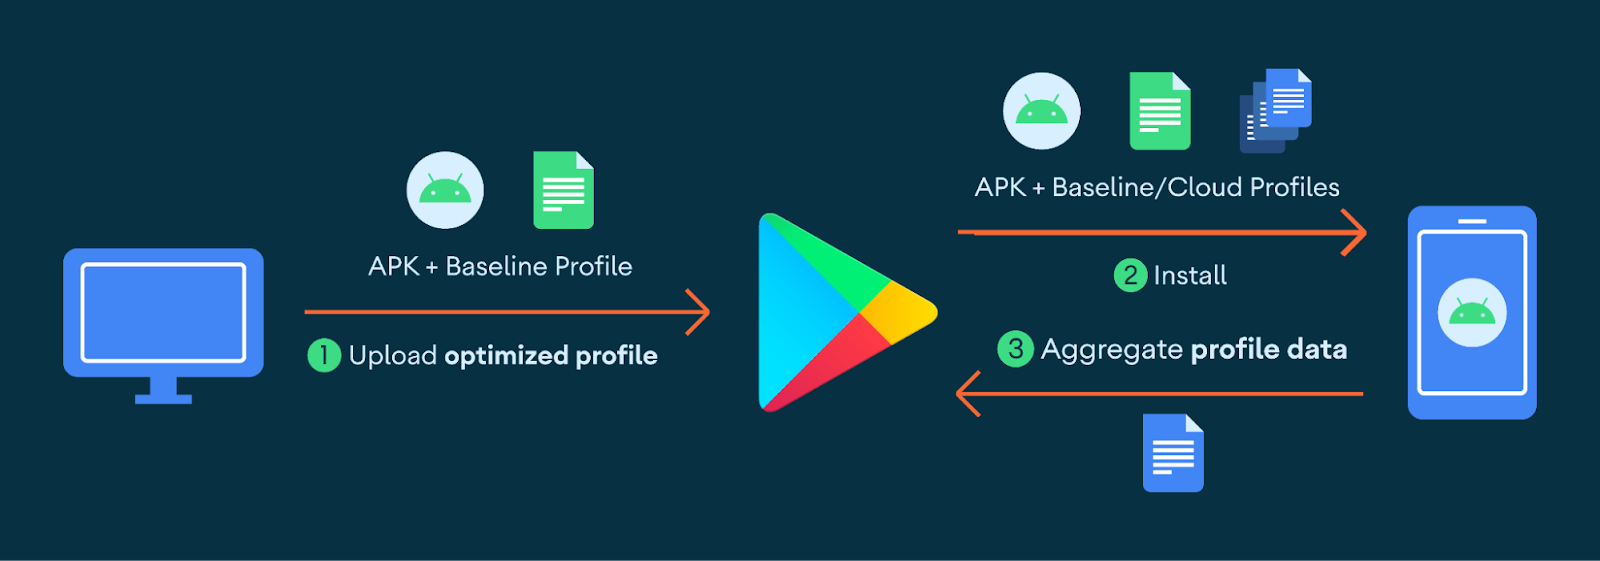 Diagram showing the flow for Baseline and Cloud Profiles in Google Play. “Improving App Performance with Baseline Profiles” by Kateryna Semenova, Rahul Ravikumar, and Chris Craik, 28 Jan. 2022. Android Developers Blog.
Baseline Profiles give full control of install time optimizations to application developers, and are available to users immediately. This allows developers to control install-time optimizations in a way which is much more tuned to the specific needs of their app than Cloud Profiles, including the ability to optimize for scenarios beyond startup.
Google offers some mechanisms of generating baseline profiles from benchmarks (e.g. Macrobenchmark). However, they can also be generated by directly specifying classes and methods in a well-specified format to a tool called profgen, which offers flexibility.
Next, we will look at how Baseline Profiles have been a very beneficial technology for the performance of Meta’s apps, solving many of the challenges with ART.
How We’ve Created Baseline Profiles at Meta
Earlier, we described challenges we have faced with our Android applications’ performance. In particular, we mentioned how our apps’ startups can load tens of thousands of classes on each cold start, and how our weekly shipping wipes all compiled code on every update.
We have long been aware of and focused on these challenges, particularly related to cold start. In the past, we have seen major performance gains via ordering classes within the underlying dex file according to their typical load position during startup, due to improved locality of reference. We call this “Interdex Ordering,” which is done via InterdexPass in Redex, our bytecode optimizer. (Google’s analog of this in R8 is called “startup profiles.”). ART’s install-time optimizations complement and improve upon this optimization by entirely eliminating the loading cost for some of these classes, and ensuring that their hot methods are compiled before the first run of the app version.
Previously, we mentioned how developers do not directly control the Cloud Profile’s contents. This particularly impacted Meta, as once a startup exceeds five seconds, the Android Runtime automatically considers the startup to be complete. This caused the Cloud Profile to insufficiently mark which classes were necessary for startup. While Cloud Profiles have undoubtedly helped here, the control and flexibility of Baseline Profiles have allowed us to fully realize the potential of these optimizations and measure large performance wins.
To create our Baseline Profiles, we use data from a variety of sources, which we process and aggregate together, based on configurations that are subject to continuous experimentation and tuning.
Collecting Profile Data
In our initial Baseline Profiles experiments, we simply used the static profiles for the AndroidX libraries that are shipped alongside them. Today, we have a sophisticated set of collection technologies we use together to produce profiles for our apps.
Benchmarks are one approach to collecting profile data. At Meta, we leverage some local benchmarks in Baseline Profile creation for some of our apps, using internal tooling we have written to collect class and method usage information. However, for apps like Facebook and Instagram, benchmarks are not sufficiently representative of production behaviour. For more complex apps like these, we additionally collect class and method usage data from users to obtain a more complete picture.
To collect class usage data from users, we make use of a custom ClassLoader, in which we insert code that logs which classes are being loaded, which is then periodically uploaded. As this collection has a performance cost, it is only conditionally enabled with a very low sample rate. The collected class load logs are then aggregated together to derive appearance frequencies, and classes exceeding a certain frequency threshold are included in the Baseline Profile for the next release.
There is no hook that allows us to log method usage as easily. However, we include some specialized telemetry into our apps that allow us to granularly identify clusters of methods that are typically called by users. We then sample and aggregate this data similarly to class data.
All of this data is then combined into a “Human Readable Profile” and fed to profgen, which generates the final Baseline Profile. Below is an example Human Readable Profile:
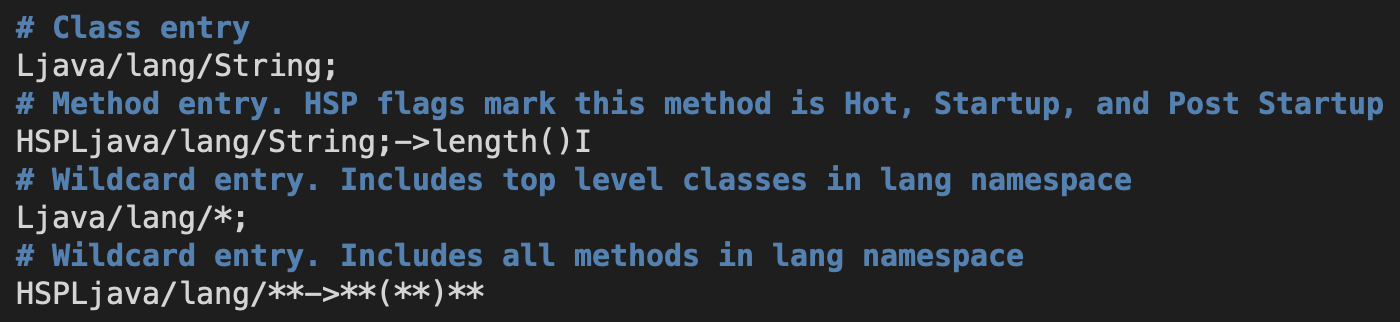
Breaking it down we can see:
- “#” are used for comment lines.
- Classes can be directly specified by their descriptor.
- Methods can be directly specified with optional flags.
- Wildcards can be used to match all classes or methods matching a given prefix.
Tuning and Experimentation
Cold start was the first scenario we wanted to optimize with Baseline Profiles. We started conservatively, with high frequency thresholds for including classes and methods into the profiles, requiring a class/method to appear in more than 80% to 90% of all collected user traces. Our concern was that shipping a Baseline Profile that was too large could actually negatively impact performance. Compiled machine code is generally 10 times larger than its original interpreted code. This size difference incurs an increased I/O cost, with more page faults or cache misses.
Over time, we have experimented with different inclusion thresholds, and have expanded beyond cold start to other user interactions. At present, we include classes and methods which appear in >= 20% of cold start user traces for most apps. Interactions we have optimized with Baseline Profiles include newsfeed scrolling in Facebook and Instagram, navigation from thread lists to thread views in Messenger and Instagram’s direct messages inbox, and general latency when navigating between app surfaces.
We have occasionally observed startup and other regressions when running experiments that increase the baseline profile size, typically with indications that memory pressure has increased. However, with targeted and carefully measured additions, we have managed to grow our profiles quite a bit larger than we expected to be possible. At present, we have several tens of thousands of entries in the Baseline Profiles for all of our apps.
The Impact of Baseline Profiles at Meta
Over the past few years, we have implemented Baseline Profiles across all of our major Android apps, and observed consistently positive results from doing so. As we have integrated and improved upon our Baseline Profiles over time, we have measured high-percentage improvements to app start, scroll performance, navigation latency between surfaces, and several other critical performance metrics, ranging from 3% all the way up to 40%.
Baseline Profiles have provided a powerful lever for our teams to meaningfully improve our users’ experience year-on-year. Our continual investment and experimentation with Baseline Profiles have proven to be well worth it. For all Android developers, whether you already use Baseline Profiles or have yet to start, we encourage you to take some of our lessons here and apply them for yourself.


