- In this post, we explore how Instagram has successfully scaled its algorithm to include over 1000 ML models without sacrificing recommendation quality or reliability.
- We delve into the intricacies of managing such a vast array of models, each with its own performance characteristics and product goals.
- We share insights and lessons learned along the way—from the initial realization that our infrastructure maturity was lagging behind our ambitious scaling goals, to the innovative solutions we implemented to bridge these gaps.
In the ever-evolving landscape of social media, Instagram serves as a hub for creative expression and connection, continually adapting to meet the dynamic needs of its global community. At the heart of this adaptability lies a web of machine learning (ML) models, each playing a crucial role in personalizing experiences. As Instagram’s reach and influence has grown, so too has the complexity of its algorithmic infrastructure. This growth, while exciting, presents a unique set of challenges, particularly in terms of reliability and scalability.
Join us as we uncover the strategies and tools that have enabled Instagram to maintain its position at the forefront of social media innovation, ensuring a seamless and engaging experience for billions of users worldwide.
Are there really that many ML models in Instagram?
Though what shows up in Feed, Stories, and Reels is personally ranked, the number of ranked surfaces goes much deeper—to which comments surface in Feed, which notifications are “important,” or whom you might tag in a post. These are all driven by ML recommendations.
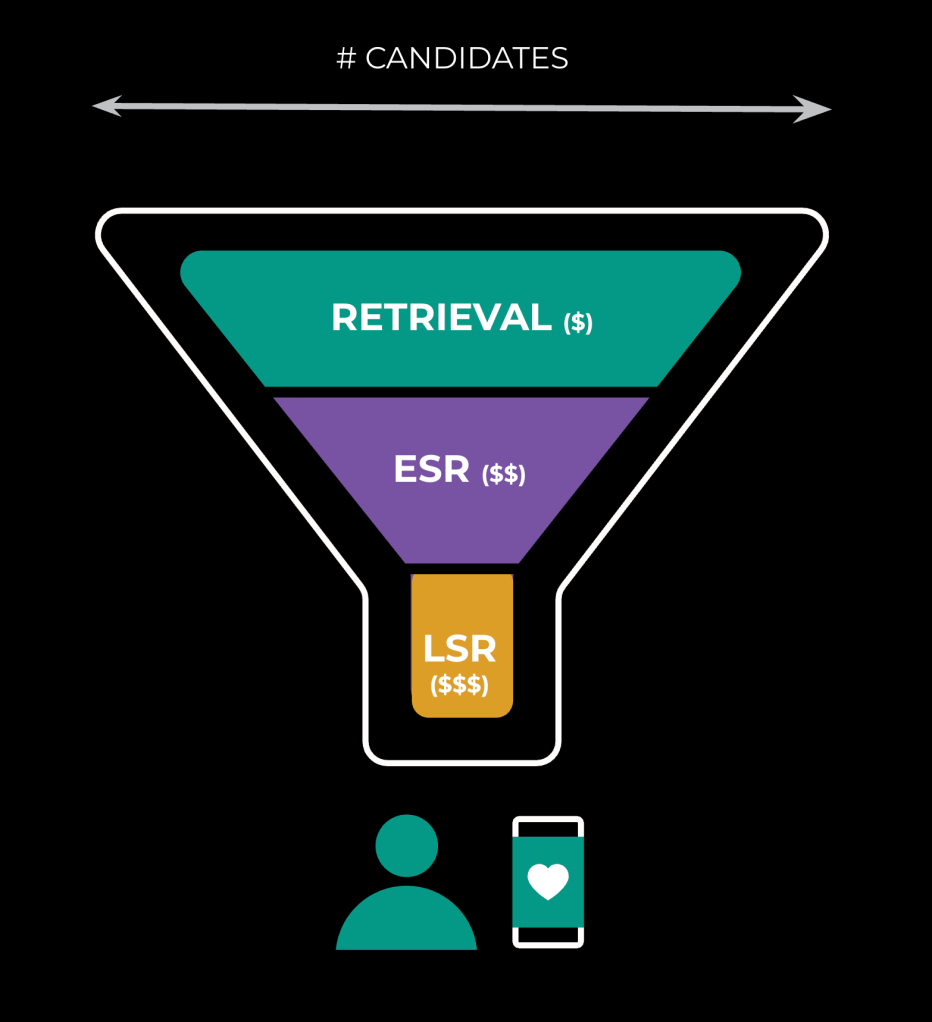
Within a given surface, we’ll have different layers of the ranking funnel: sourcing (retrieval), early-stage ranking (ESR), and late-stage ranking (LSR). We operate on fewer candidates as we progress through the funnel, as the underlying operations grow more expensive (see Figure 1 below):
Within each surface and layer, there is constant experimentation, and these permutations create a severe infrastructure challenge. We need to allow room for our ML engineers to experiment with changes such as adjusting weights for a given prediction. The net result, depicted below in Figure 2, is a large number of models serving user traffic in production:

How did we realize infra maturity wasn’t going to catch up?
Identified risks
We identified several risks associated with scaling our algorithm, rooted in complaints about ML productivity and repeating patterns of issues:
- Discovery: Even as a team focused on one app — Instagram — we couldn’t stay on top of the growth, and product ML teams were maintaining separate sources of truth, if any, for their models in production.
- Release: We didn’t have a consistent way to launch new models safely, and the process was slow, impacting ML velocity and, therefore, product innovation.
- Health: We lacked a consistent definition of model prediction quality, and with the diversity of surfaces and subtlety of degraded ranking, quality issues went unnoticed.
Solution overview
To address these risks, we implemented several solutions:
- Model registry: We built a registry that serves as a ledger for production model importance and business function foremost, among other metadata. This registry serves as our foundational source of truth, upon which we can leverage automation to uplevel system-wide observability, change management, and model health.
- Model launch tooling: We developed a more ideal flow for launching new models that includes estimation, approval, prep, scale-up, and finalization. This process is now automated, and we’ve reduced the time it takes to launch a new model from days to hours.
- Model stability: We defined and operationalized model stability, a pioneering metric that measures the accuracy of our model predictions. We’ve leveraged model stability to produce SLOs for all models in the model registry, which enables simple understanding of the entire product surface’s ML health.
Model registry
What did model investigations look like prior to the registry?
Before we created the model registry, the investigation process was a time-consuming and error-prone experience for on-call engineers and model owners. An on-call engineer had to ask multiple questions to model owners to gather information, as depicted Figure 3 below, about the context of what this model does in the stack and to clarify how important it is to the business.
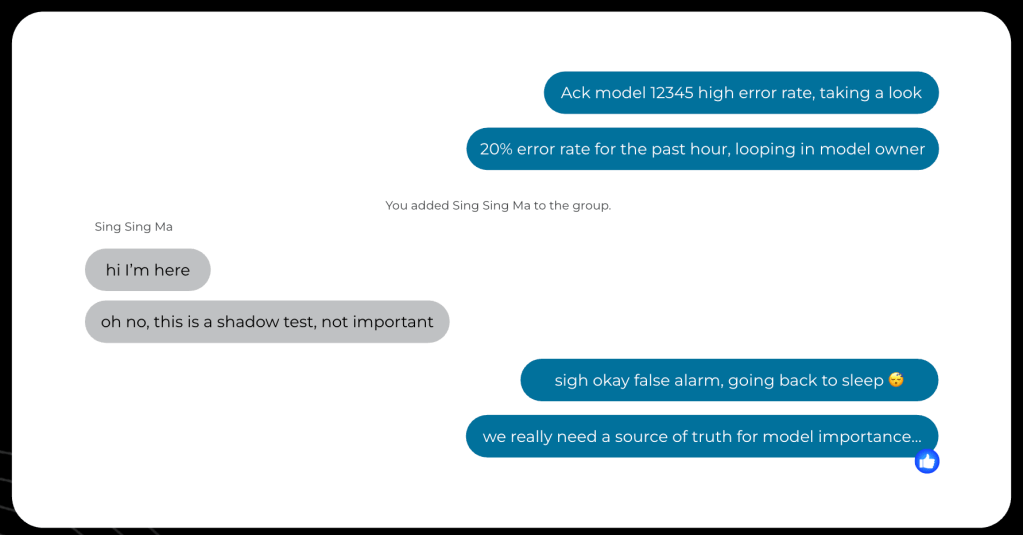
Understanding this context is extremely important to the operational response: Depending on the importance of the model and the criticality of the surface it’s supporting, the response is going to differ in kind. When a model is an experiment serving a small percentage of the traffic, an appropriate response can be to end the experiment and reroute the traffic back to the main model (the baseline). But if there’s a problem with the baseline model that needs to be handled with urgency, it’s not possible to “just turn it off.” The engineer on call has to loop in the model owner, defeating the purpose of having a dedicated on-call.
To avoid holding up an operational response on a single POC, we needed a central source of truth for model importance and business function. What if the model is not available? What if 10 of these issues happen concurrently?
With the development of the model registry, we standardized the collection of model importance and business function information, ensuring most of our operational resources were going towards the most important models.
What problems did the model registry solve?
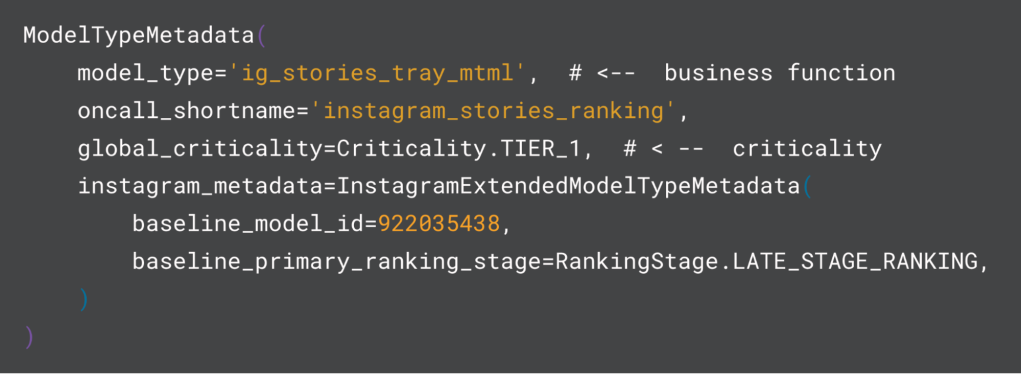
The model registry is a system of record built on top of Configerator, Meta’s distributed configuration suite . This schematized ledger (see an example in Figure 4 and detailed further below) provides read-and-write access to operational data based on the inventory of production models. It’s a flexible and extensible foundation upon which one can build automation and tools to solve problems that are specific to individual organizations within Meta that are not served by the general tooling.
As Instagram scaled its investment in AI through rapid innovation in content recommendations, the number of models and AI assets grew; as a result, it has been increasingly important — but also increasingly difficult — to maintain a minimum standard for all of our models, as we lacked an authoritative source for the business context as well as for a model’s importance.
In creating the model registry, we set out to provide a structured interface for collecting business context via model types, importance via criticality, and additional metadata that would enable model understanding. Below, we’ll get into the model types, criticality, and automation we’ve built for this purpose.
Model types
At a high level, model type describes the purpose for the ML workload where it represents a category or class of models that share a common purpose or are used in similar contexts. For example, we have “ig_stories_tray_mtml” which is a string attached to training flows, model checkpoints, inference services, and more. Put simply, a model type identifies for the reader this model’s purpose in the ranking funnel.
Let’s break it down:
“ig_stories_tray_mtml” → “ig” “stories” “tray” “mtml”
- “ig”: This model is an “ig” model as opposed to “fb” or “whatsapp”.
- “stories”: This model serves IG Stories.
- “tray”: This model serves in the main IG Stories tray (as opposed to stories in some other surface).
- “mtml”: This model is a multi-task-multi-label model, commonly used in late-stage ranking.
We can then use these model type strings to tag AI assets, and since they serve as proxies for business context, we can use them also for asset management, policy enforcement, analytics, and more.
The metadata entries in the model registry are anchored on two main types that describe model instances (ModelMetadata) as well as model types (ModelTypeMetadata). These types are made up of “core” attributes that are universally applicable, as well as “extended” attributes that allow different teams to encode their opinions about how these entries will inform operations. For example, in Instagram our extended attributes encode “baseline” and “holdout” model IDs, which are used in our ranking infrastructure to orchestrate ranking funnel execution.
Criticality
In addition to defining business function, we had to establish clear guidelines for model importance. Within Meta, SEVs and services have a unified-importance tier system where the Global Service Index (GSI) records a criticality from TIER0 to TIER4 based on the maximum incident severity level the service can cause, from SEV0 as the most critical to SEV4 as simply a “heads up.” Since GSI criticality had social proof at the company, and infra engineers were familiar with this system, we adopted these criticalities for models and now annotate them at the model type and model level.
No longer would each team decide to raise their own model services to TIER1 for themselves, increasing the burden on all teams that support these models. Teams needed to provide an immediate response (available 24/7) on call and be able to prove that their models contributed meaningfully to critical business metrics to qualify for elevated monitoring.
Configuration structure as a foundation for automation
Once we had onboarded a critical mass of Instagram models to the model registry, we could begin to fully integrate with our monitoring and observability suite using our Meta-wide configuration solution, Configerator. With this, we could now have model performance monitoring and alerts that are fully automated and integrated with our tooling for SLIs called SLICK, dashboards that allow us to monitor models across many time series dimensions, and a suite of alerting specific to the model that is driven from the entries in the model registry.
This provided all our teams confidence that our monitoring coverage was complete and automated.
Launching
While a point-in-time snapshot of models in production is great for static systems, Instagram’s ML landscape is constantly shifting. With the rapid increase of iteration on the recommendation system driving an increased number of launches, it became clear our infrastructure support to make this happen was not adequate. Time-to-launch was a bottleneck in ML velocity, and we needed to drive it down.
What did the process look like?
Conventionally, services were longstanding systems that had engineers supporting them to tune. Even when new changes would introduce new capacity regression risks, we could gate this behind change safety mechanisms.
However, our modeling and experimentation structure was unique in that we were planning for more rapid iteration, and our options were insufficient. To safely test the extent of load a new service could support, we would clone the entire service, send shadow traffic (i.e., cloned traffic that isn’t processed by our clients), and run multiple overload tests until we found a consistent peak throughput. But this wasn’t a perfect science. Sometimes we didn’t send enough traffic, and sometimes we’d send too much, and the amount could change throughout the day due to variations in global user behavior.
This could easily take two days to get right, including actually debugging the performance itself when the results weren’t expected. Once we got the result, we’d then have to estimate the final cost. Below (in Figure 5) is the formula we landed on.

The actual traffic shifting portion was tedious as well. For example, when we managed to fully estimate that we needed 500 replicas to host the new service, we might not actually have 500 spares lying around to do a full replacement, so launching was a delicate process of partially sizing up by approximately 20%, sending 20% of traffic over, and then scaling down the old service by 20% to reclaim and recycle the capacity. Rinse, repeat. Inefficient!
And by the time we got to the end of this arduous process, the ordeal still wasn’t over. Each team was responsible for correctly setting up new alerts for their baseline in a timely fashion, or else their old models could and did trigger false alarms.
How does forcing virtual pools aid product growth?
One of the prerequisites for fixing competition for resources and unblocking productivity was to put up guardrails. Prior to this, it was “first come first served,” with no clear way to even “reserve” future freed capacity. It was also hard to reason about fairness from an infra perspective: Would it make sense to give each team equal pools, or give each individual person a maximum limit?
As it turned out, not all MLEs are experimenting at the same time, due to staggered progress on their work, so individual (per-engineer) limits were not ideal. One member might be in the experimentation stage and another might be training. So our solution was to provide bandwidth to each team.
Once each team — and therefore product — had quotas distributed, their launch policy became more clear cut. Some teams established free launching as long as the team was within quota. Others required no regressions in capacity usage. But mostly this unlocked our ability to run launches in parallel, since each one required much less red tape, and prioritization was no longer done at the org level.
What other tooling improved launching?
As mentioned earlier, preplanning with capacity estimations was critical to understanding cost and ensuring reliability. We were often asked, Why not let autoscaling take care of everything? The problem was that each service could be configured slightly differently than a previously optimized service, or some architectural change could have affected the performance of the model. We didn’t have an infinite amount of supply to work with, so by the time we fully traffic-shifted everything over, we might find that we didn’t have enough supply. Reverting is costly, taking hours to get through each stage.
By doing capacity estimations in advance, this also allowed us and each team to accurately evaluate metric improvement versus cost. It might be worthwhile to double our costs if something would increase time spent on the app by 1%, but likely not for a 0.05% improvement where we could better spend that capacity funding another initiative.
With partners in AI Infra, we developed two major solutions to this process: offline performance evaluation and an automated launching platform.
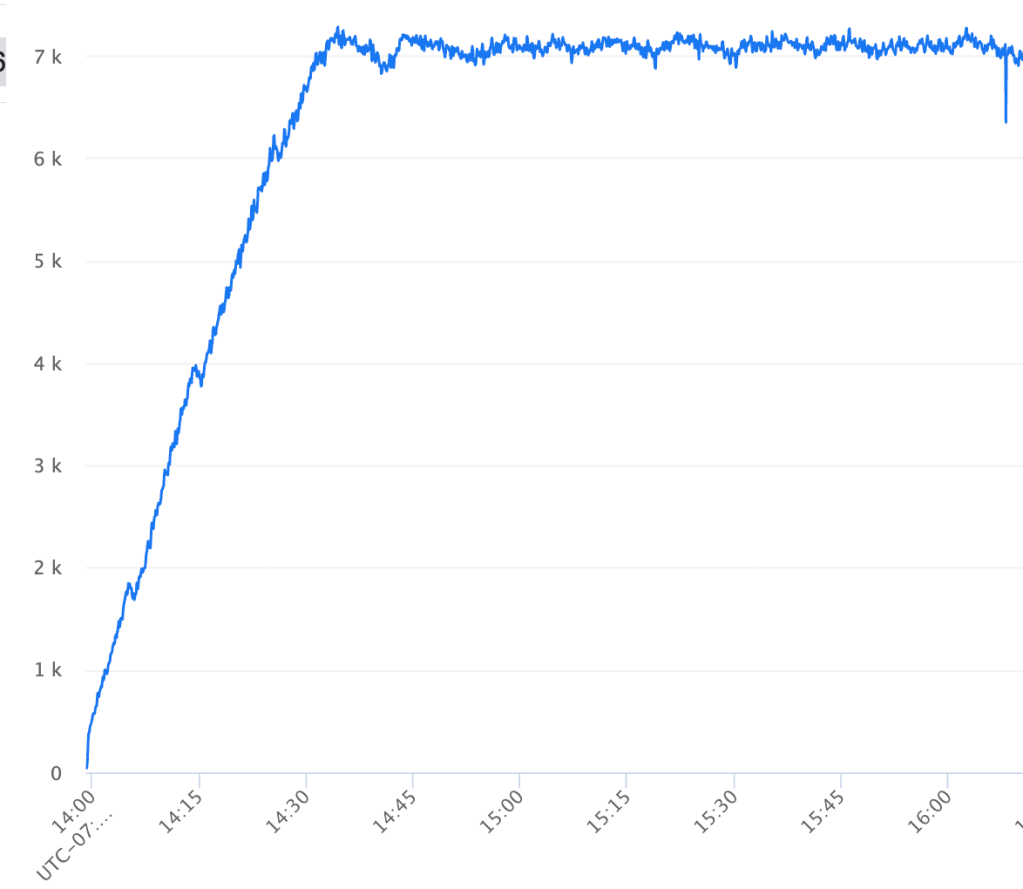
We simplified determining performance of a new service using recorded traffic. Pre-recorded traffic was continuously collected into a data warehouse that the benchmarker could read from, and we’d spin up temporary jobs with this automation. One job would replay different levels of traffic continuously and send it to another job that was a clone of the existing experiment. By putting stoppers on desired latency and error rates, the tooling would eventually output a converged stable number that we could understand as the max load (see Figure 6).
The launch platform itself would input the numbers we captured from these tests, automatically collect demand data as defined, and run that same formula to calculate a cost. The platform would then perform the upscaling/downscaling cycle for teams as we shifted traffic.
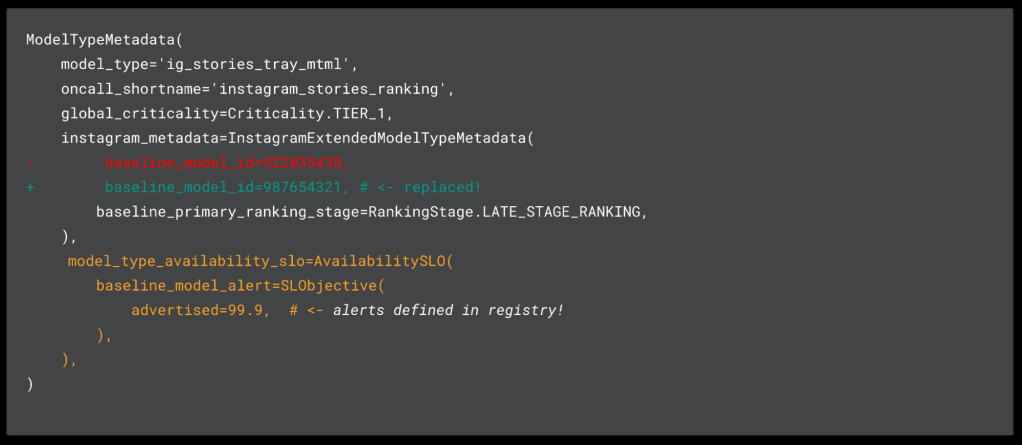
And finally, by leveraging the model registry, we were able to land this model change in code (see example in Figure 6), to help us better maintain and understand the 1000+ models within our fleet. Likewise, this bolstered our trust in the model registry, which was now directly tied to the model launch lifecycle.
This suite of launch automation has dramatically reduced the class of SEVs related to model launches, improved our pace of innovation from a few to more than 10 launches per week, and reduced the amount of time engineers spend conducting a launch by more than two days.
Model stability
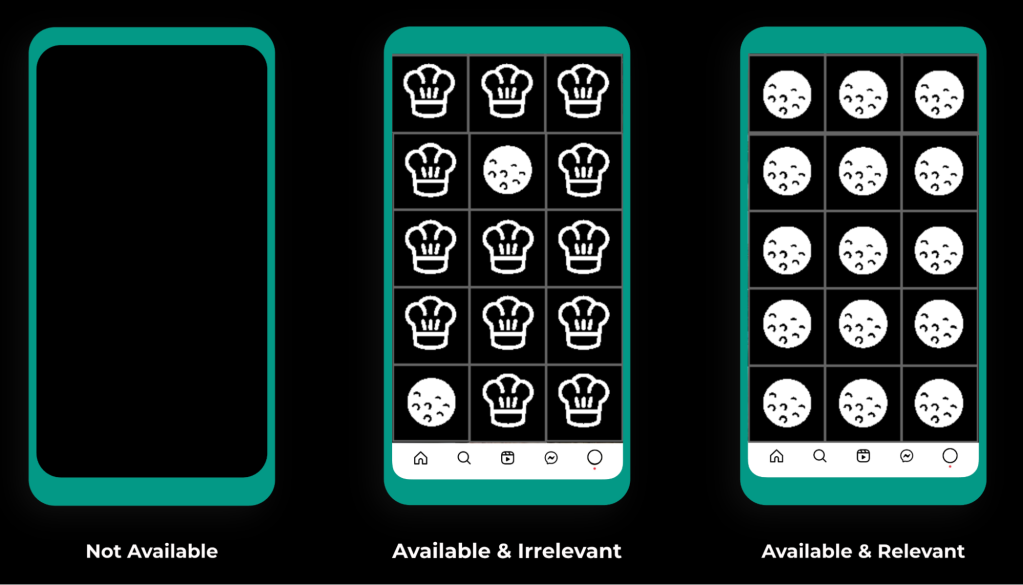
As the number of models in production increased, our organization started to feel the effects of an inconsistent measure of model health. While ranking models are run like any other distributed backend system (receive a request, produce a response), one may think a universal SLO that measures request success rate can suffice to capture holistic health. This is not the case for ranking models, as the accuracy of recommendations received carries significant importance to the end-user experience. If we consider a user who is a huge fan of golf but does not enjoy cooking content (see the “available & irrelevant” case in Figure 8 below), we see an example of this inaccuracy in practice. This is precisely what the model stability metric sought to capture.
Why is measuring ranking model reliability unique?
Ranking models, unlike traditional idempotent request/response backends, produce scores predicting user action given a set of candidates (PLIKE, PCOMMENT, PFOLLOW, etc.). These scores then combine and are used to determine which candidates are most relevant to an end user. It’s important that these scores accurately reflect user interest, as their accuracy is directly correlated to user engagement. If we recommend irrelevant content, user engagement suffers. The model stability metric was designed to make it easy to measure this accuracy and detect inaccuracy at our scale.
Let’s discuss how this works.
Defining model stability
Models are complex, and they produce multiple output predictions. Let’s take a simplified example (shown in Figure 9 below) of a multi-task-multi-label (MTML) model predicting three actions:
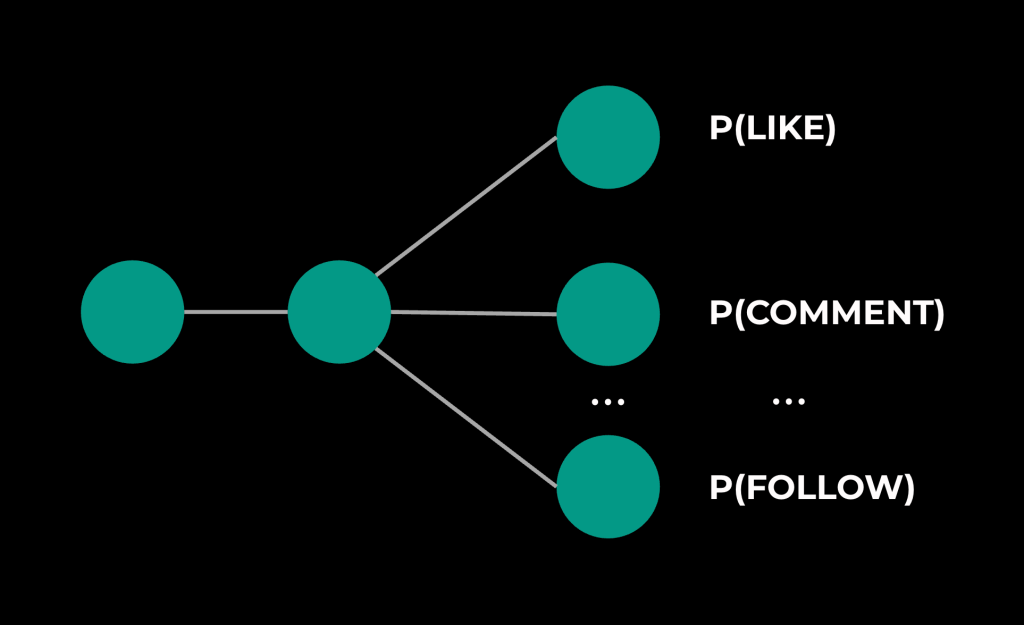
For us to claim this model is stable, we must also claim that each underlying prediction is stable.
When evaluating the accuracy of a ranking model’s predictions, we typically look at two metrics:
- Model calibration, which is based on observed real-world outcomes and answers the question, “Are we over- or under-predicting user action?” It is calculated as a ratio of predicted click-through-rate (CTR) and empirical CTR. A perfect predictor will have calibration centered at 1.
- Model normalized entropy (NE), which measures the discriminative power of a predictor, and answers the question, “How well can this predictor separate action from inaction?” It is calculated as a ratio of the average log-loss per impression to what the average log-loss per impression would be if we always predicted the empirical CTR. With NE, lower values are better, and an NE of 1 is equivalent to random predictions.
(For more information regarding our choice of prediction evaluation metrics, please refer to the paper, “Practical Lessons from Predicting Clicks on Ads at Facebook.”)
A model’s predictions are unstable when either calibration or NE are out of their expected healthy ranges. To determine what a healthy range is, we must look at each metric in real time, and Figure 10 below shows what these time series can look like:
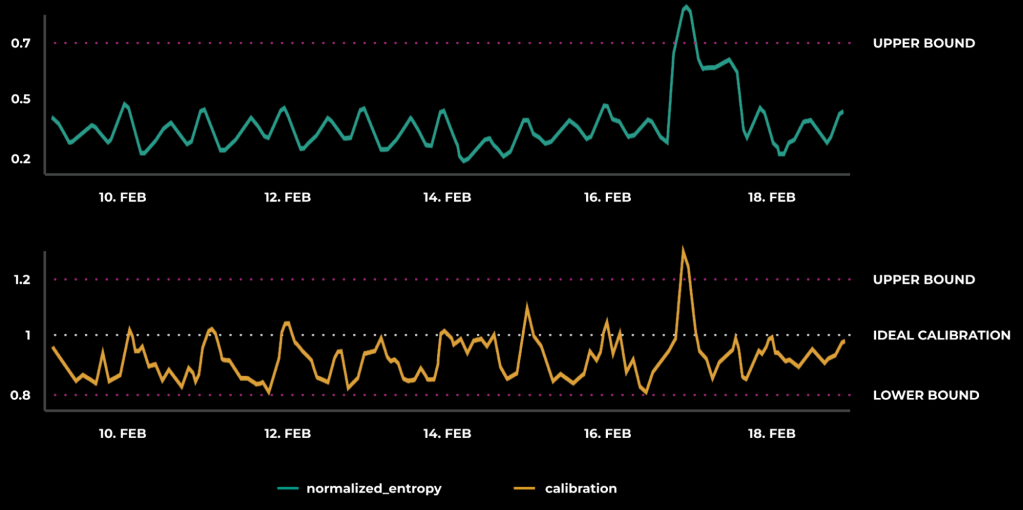
By observing the trend of a healthy prediction, we can apply thresholds for our evaluation metrics. When these thresholds are breached, the underlying prediction is considered unstable.
From here, we can define model stability as a binary indicator across a model’s predictions. It is 1 if all underlying predictions are stable, and 0 if any prediction is unstable. This is an extremely powerful method of reacting to real-time prediction instability as well as a tool for understanding trends in predictive health per model or across distinct products ranking funnels.
Operationalizing model stability
With a real-time view on model predictive health, we can leverage this unified definition of model stability and apply it to all of our models in production, once again leveraging the model registry as a ledger to hold this important data. In Figure 11 below, we can see the addition of model stability metric metadata after we determined the expected thresholds.

Given the large number of models in production, each producing many predictions, building a portable definition of model health applicable to all of our ranking models represented an important milestone toward upleveling Instagram’s ML infrastructure maturity. This has unlocked our ability to build generic alerting to guarantee detection of our most important models becoming unstable, thereby moving us closer to mitigation when our recommendation system is at risk.
Since the addition of these metrics and alerting, ML teams have discovered previously hidden issues within their models and addressed them faster than before, leading to higher-quality recommendations.
Key takeaways
In our journey to scale Instagram’s algorithm to manage over 1000 models, we have learned several critical lessons that have shaped our approach and infrastructure. These takeaways not only highlight the challenges we faced but also underscore the strategies that led to our success.
Infra understanding is the foundation to building the right tools
A unified understanding of our infrastructure footprint was essential in developing the right tools to support our scaling efforts. By identifying the gaps and potential risks in our existing systems, we were able to implement solutions such as the model registry that significantly improved our operational efficiency and reliability posture.
Helping colleagues move fast means we all move faster
By addressing the model iteration bottleneck, we enabled our teams to innovate more rapidly. Our focus on creating a seamless, self-service process for model iteration empowered client teams to take ownership of their workflows. This not only accelerated their progress but also reduced the operational burden on our infrastructure team. As a result, the entire organization benefited from increased agility and productivity.
Reliability must consider quality
Ensuring the reliability of our models required us to redefine how we measure and maintain model quality. By operationalizing model stability and establishing clear metrics for model health, we were able to proactively manage the performance of our models. This approach enables us to maintain high standards of quality across our recommendation systems, ultimately enhancing user engagement and satisfaction.
Our experience in scaling Instagram’s recommendation system has reinforced the importance of infrastructure understanding, collaboration, and a focus on quality. By building robust tools and processes, we have not only improved our own operations but also empowered our colleagues to drive innovation and growth across the platform.