
- We are introducing a new metric— real-time server fleet utilization effectiveness —as part of the RETINAS initiative to help reduce emissions and achieve net zero emissions across our value chain in 2030.
- This new metric allows us to measure server resource usage (e.g., compute, storage) and efficiency in our large-scale data center server fleet in near real-time.
- We are sharing our learnings in adopting depreciation methods for accumulated carbon assets for internal fleet measurements, and encourage further industry improvement and development on these concepts. This is not intended to replace global emissions accounting standards for purposes of external reporting.
Since 2020, Meta has maintained net zero emissions in our operations and matched 100% of our electricity use with renewable energy. However, we know our work doesn’t stop there, and we recognize our responsibility to decarbonize our footprint beyond our data centers and offices, including emissions from the server components our suppliers manufacture to our employees’ commutes. To align with the Paris Agreement, we have set a goal to reach net zero emissions across our value chain in 2030.
Meta’s Net Zero Program has three foundational pillars: understanding our emissions, reducing our emissions, and removing remaining emissions. To understand our emissions, improving the granularity, accuracy, and near real-time measurement of our greenhouse gas data goes beyond carbon accounting. The right data will help us apply actionable metrics to advance decarbonization across our business operations and with our suppliers.
With this in mind, we have created the Real Time Infrastructure Accounting for Sustainability (RETINAS) initiative, which seeks to study and understand the impact of server reliability, performance, and operational optimization on Meta’s Scope 3 emissions.
This initiative has led to the development of a new internal metric— real-time server fleet utilization effectiveness —that enables us to take action to reduce the emissions associated with the embodied carbon of our data center servers and components. Embodied carbon contributes to Meta’s upstream Scope 3 emissions, and includes the emissions associated with the full lifecycle of the manufacturing, assembly, and transportation of servers and materials in our physical infrastructure.
Optimizing the utilization of our server fleet is important to reducing these emissions. Real-time server fleet utilization effectiveness provides a framework toward effective measurement and integration of embodied carbon into ubiquitous infrastructure metrics to drive informed decisions to manage our server fleet resource usage (e.g., compute and storage) and their impacts on Meta’s Scope 3 emissions.
How we measure greenhouse gas emissions at Meta
Since 2011, Meta has reported our Scope 1 and 2 emissions. In 2017, we began reporting select Scope 3 emissions categories. Since 2019 we have reported annually on all relevant emissions defined by the Greenhouse Gas Protocol. We obtain limited assurance conducted by a third party for select environmental metrics. In our accounting, data center servers and their components are a significant driver of our Scope 3 emissions footprint, and we have taken numerous steps to deepen our understanding of those emissions in order to surface reduction opportunities.
An important reduction strategy we are focused on is the circularity of our servers and components. The more effectively and efficiently servers are utilized, the more sustainable the server fleet. We can extend the lifespans of servers, components, and network infrastructure with improvements to server reliability, efforts to reuse components based on their reliability expectations, and various performance optimizations and operational improvements (e.g., firmware/server upgrades and repairs).
While implementing these circularity strategies, we observed limitations in current carbon accounting practices to understand and weigh Scope 3 emissions trade-offs in our server fleet against traditional power, performance, and total cost of ownership (TCO) metrics, such as performance per dollar, performance per watt, and performance per dollar per watt, in real-time.
Current carbon accounting and reporting practices for Scope 3 emissions are static. For data center servers and components, in particular, this means that the entirety of the embodied emissions from the upstream supply chain, manufacturing, and logistics is attributed in the year of purchase. Benefits from circularity are not realized in our Scope 3 footprint until future purchases of new servers or components are deferred. This does not provide actionable information to our operational teams in real-time on how varying the usage or the expected life of the acquired servers can impact Meta’s Scope 3 emissions.
We see a need to develop internal metrics to monitor and incentivize greater efficiency, utilization, and extension of the expected life of servers, which will influence current and future server fleet management.
Introducing real-time server fleet utilization effectiveness
The RETINAS initiative, launched by Meta’s Infrastructure Engineering team, seeks to study and understand how server reliability, performance, and operational optimization impact Meta’s Scope 3 emissions. To understand this holistically, we introduced a standardized, fleet-wide metric for any given resource (e.g., a server or rack) that measures the utilization of embodied carbon:

Where:


This metric borrows depreciation concepts from finance and accounting practices and applies them to aspects of server reliability, efficiency, and useful life. The concept of depreciation is used to showcase the expected useful life of acquired assets. This concept also allows for tracking of acquisition and disposition of server resources at fleet scale and is reported on an ongoing basis.
Utilization metrics like power usage effectiveness (PUE) and hardware usage effectiveness (HUE) measure the effective IT usage from a power perspective at the data center and server level, respectively. Combining depreciated Scope 3 emissions with these utilization metrics allows us to standardize these measurements along with other fleet health measurements for a defined period of time.
We illustrate the usage of this metric with a set of servers and various circularity strategies.
Example (current static state)
Let’s consider an example set of servers purchased in 2023 which have associated embodied emissions attributed to the buyer with 1000 tons of CO2e. Here is how this would be represented using current, static carbon accounting methods:
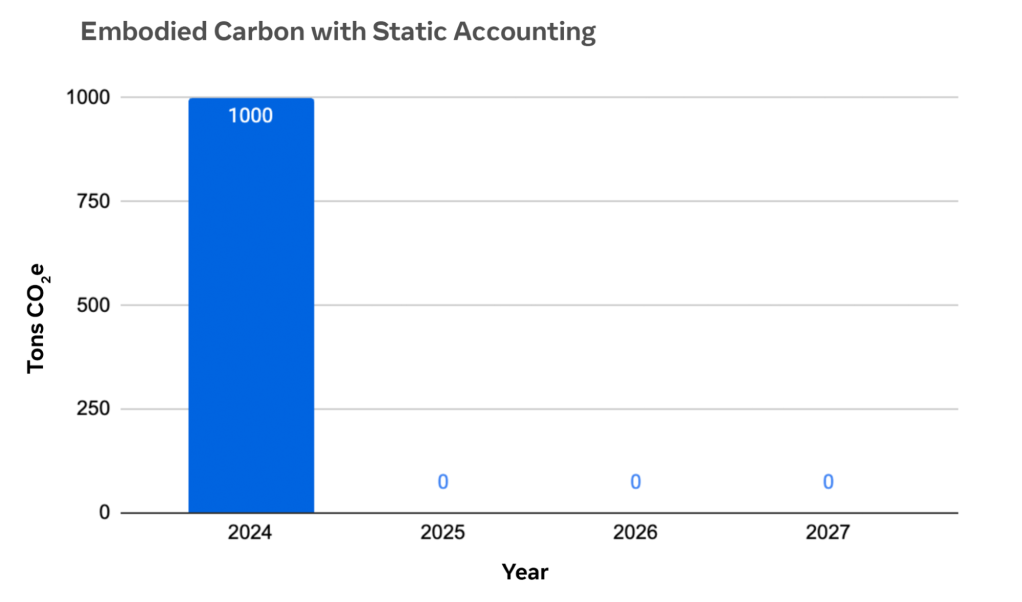
There is no representation for the useful life of the example set of servers. If we change the server set’s useful life (UL) from four years to five years, the metric doesn’t move.
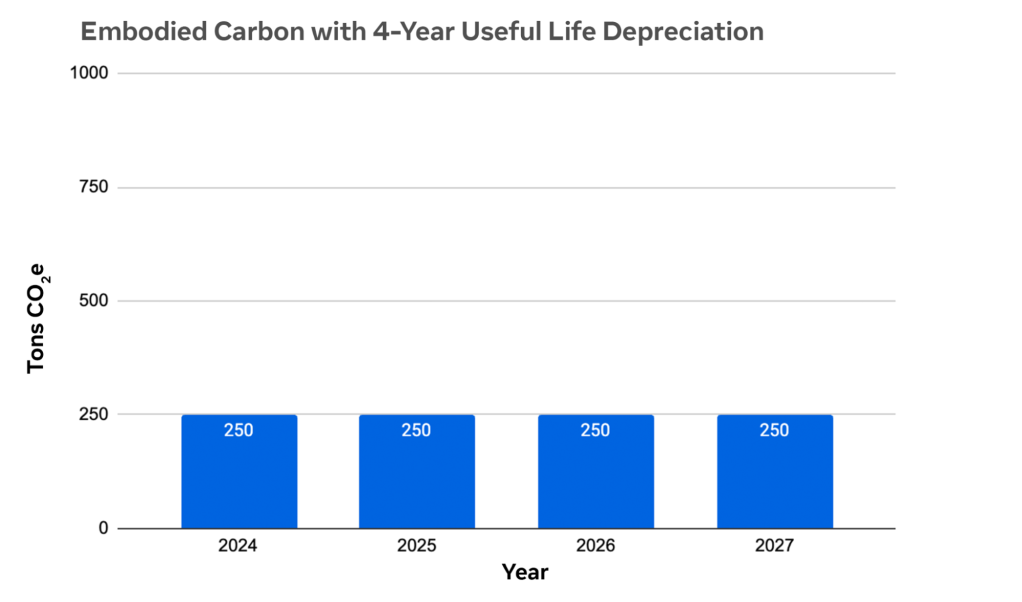
Example (with proposed dynamic accounting)
For the same example of servers purchased in 2023 with 1000 units of CO2e Scope 3 emissions, we use the concept of depreciation over a period of useful life of four years (example time horizon):
Depreciation in action:
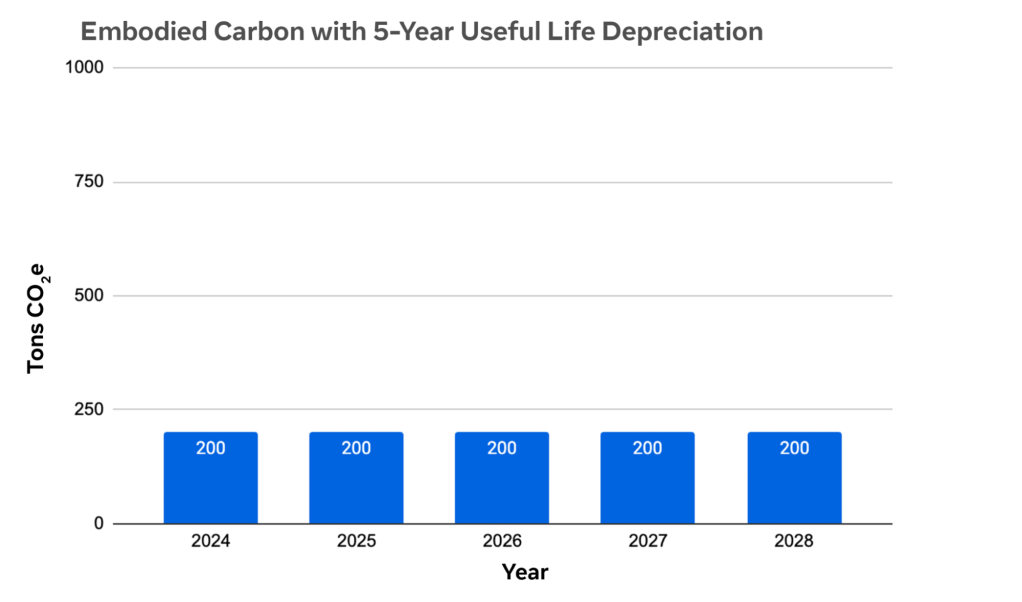
If the server set’s useful life is modified from four years to five years, this would be visible as part of the depreciation metric and showcase the longevity of resource usage.
Effective change in depreciation with extension (from 4y UL to 5y UL):
Within large-scale infrastructure, there are different layers of availability within the hardware and software stack, such as hardware, firmware, the kernel, the operating system, and the application. At each layer, there are metrics associated with efficiency based on available capacity, resources, and their effective use. To represent the use of a depreciation-based metric, we examine the efficiency of a service at the application stack. The representative graph below showcases an example set of variations in the utilization effectiveness stemming from application improvements over a larger time scale.
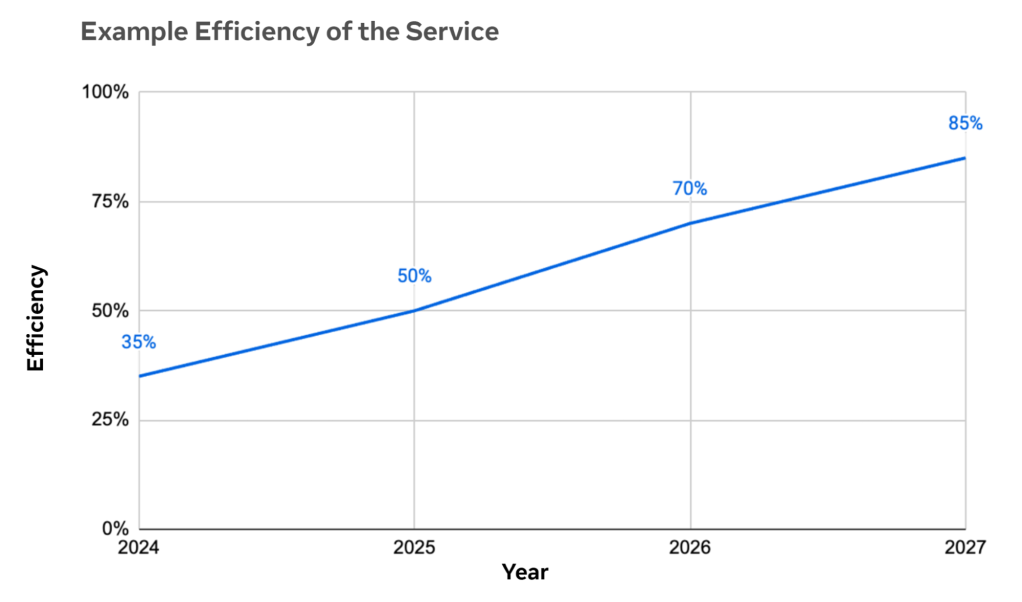
Utilization effectiveness is defined as: Total resource available / Resource utilized
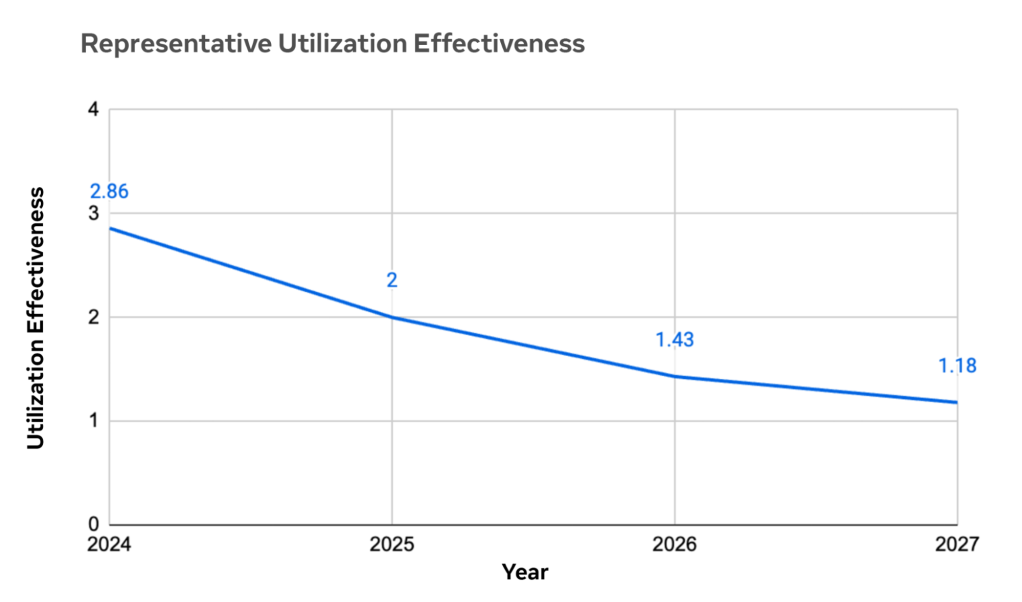
Combining the depreciation of embodied emissions resources per unit time to the utilization effectiveness for a given unit of time (say, every year), we can arrive at a more real-time measurement of server fleet utilization effectiveness of embodied carbon. (Note: The measurements for utilization effectiveness in the chart are representative values).
Our goal is to consistently minimize the real-time server fleet utilization effectiveness. Utilization effectiveness ideally is decreasing asymptotically towards 1, when resources available are 100% utilized. Depreciation of Scope 3 emissions over a longer period of time due to a longer useful life will also minimize this metric. Combined, this metric allows for ranking of different efforts one must pursue within the server fleet and compare and contrast efficiency improvements, reliability efforts like extensions or initial component selection, and associated embodied carbon impacts.
Below is the comparison of real-time server fleet utilization effectiveness and the way the metric behaves under server life extension and efficiency improvements with the above considered scenarios.
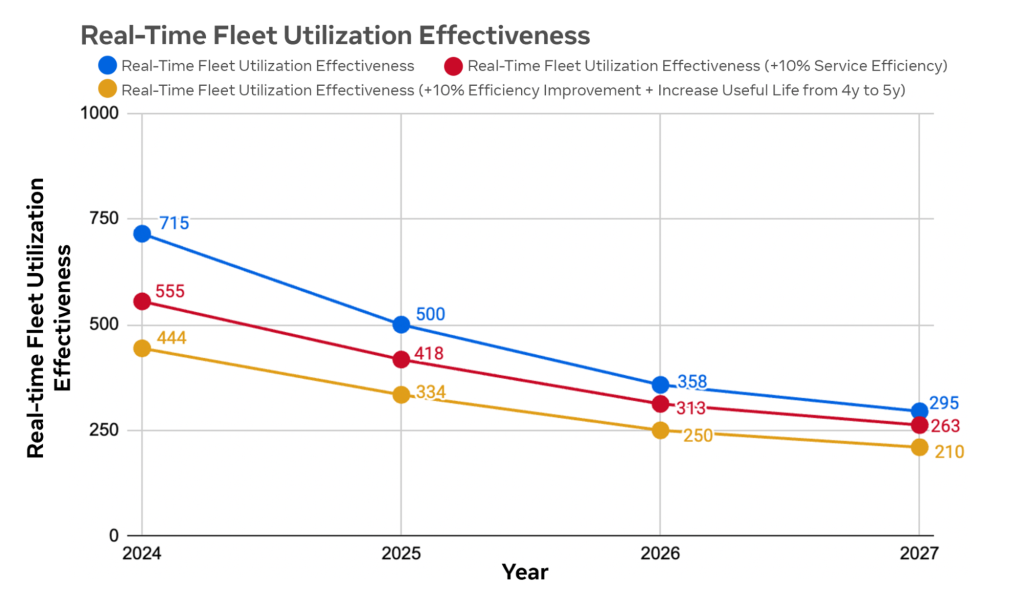
Characteristics of the metric:
The metric above can enable relative comparison of circularity strategies on the server fleet. It can be sliced horizontally into any given timescale (from seconds to years) for understanding a resource’s (e.g., servers or racks) embodied emissions attribution giving fine-grained real-time insights for the server fleet. The metric can also be vertically sliced to obtain utilization effectiveness at different layers of the stack, from entire servers, to containers, to production workloads, to app residencies for short durations – combining that with the associated resource available for the chosen abstraction.
To illustrate how this metric can be used, using the same set example as above:
- Increasing server useful life from five years to seven years lowers the metric by 28% due to slower depreciation.
- Enabling reuse of a component, pursuing an application efficiency improvement, or choosing server parts that have lower emissions will contribute towards the metric and enable cross-stack tradeoff.
To close, we can observe in this example that this single metric ties together different fleet operations towards a single goal of reducing embodied emissions, delivering insights for decision making at any given time horizon. By integrating depreciation and utilization effectiveness to embodied carbon, our operational and server fleet management teams can leverage this metric to make data-driven decisions that address an important portion of Meta’s Scope 3 footprint.


