Every day people upload more than 350 million photos to Facebook as of December 2012 and view many more in their News Feeds and on their friends’ Timelines. Facebook stores these photos on Haystack machines that are optimized to store photos. But there is also a deep and distributed photo-serving stack with many layers of caches that delivers photos to people so they can view them.
We recently published an academic study of this stack in SOSP. In this post, we describe the stack and then cover four of our many findings:
- 1. How effective each layer of the stack is.
- 2. How the popularity distribution of photos changes across layers.
- 3. The effect of increasing cache sizes.
- 4. The effect of more advanced caching algorithms.
Facebook’s photo-serving stack

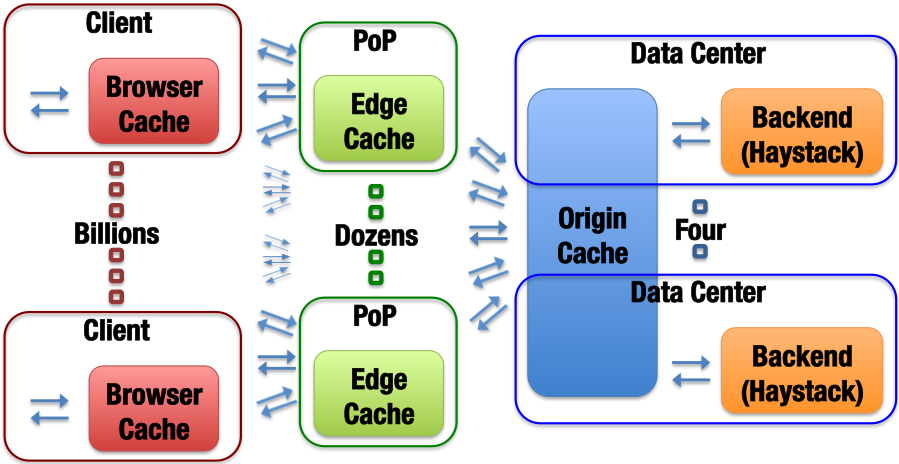
The photo-serving stack has four layers: browser caches, edge caches, origin cache, and Haystack backend. The first layer of the stack is the browser cache on peoples’ machines. If someone has recently seen or downloaded a photo, that photo will likely be in their browser cache and they can retrieve it locally. Otherwise, their browser will send an HTTPS request out to the Internet.
That request will be routed either to our CDN partners or to one of Facebook’s many edge caches, which are located at Internet points of presence (PoPs). (In the paper and this blog post, we focus on what happens in the Facebook-controlled stack.) The particular edge cache that a request is routed to is encoded in the request’s URL. If the requested photo is present at the edge cache, then it returns the photo to the user’s browser, which will store it in its local cache. If the photo is not present at the edge cache, it is requested from the origin cache.
The origin cache is a single cache that is distributed across multiple data centers (like Prineville, Forest City, and Lulea). Requests from the edge caches are routed to hosts in the origin cache based on the requested photo’s ID. This means that for a single picture, all requests to the origin cache from all edge caches will be directed to the same server. If the requested photo is present in the origin cache, it is returned to the person via the edge cache, which now will store the photo. If the requested photo is not present, it is fetched from the Haystack backend.
The Haystack backend stores all photos, so all requests can be satisfied at this layer. Requests from the origin cache are typically filled by Haystack machines in the same data center. If for some reason the local Haystack machine is unavailable, the origin cache will request the photo from a Haystack machine in another data center. In either case, the photo flows back up the caching stack being stored at each layer as it goes: origin cache, edge cache, and then browser cache.
Trace collection
In our study, we collected a month-long trace of requests from non-mobile users for a deterministic subset of photos that was served entirely by the Facebook-controlled stack. The trace captures hits and misses at all levels of the stack, including client browser caches. All analysis and simulation is based on this trace.

From our trace we determined the hit ratio at each of the layers and the ratio of total requests that travels past each layer. Each layer significantly reduces the volume of traffic so that the Haystack backend only needs to serve 9.9% of requested photos.
This is a significant reduction in requests, but we can do even better.
Shifting popularity distributions
It is well known that the popularity of objects on the web tends to follow a power law distribution. Our study confirmed this for the Facebook photo workload and showed how this distribution shifts as we move down layers in the stack. We counted the number of requests for each photo at every layer, sorted them by popularity, and then graphed them on a log-log scale. The power law relationship shows up as linear on this scale.

As we move down the stack, the alpha parameter for the power law distribution decreases and flattens out. The distribution also changes to one that more closely resembles a stretched exponential distribution.
Serving popular photos
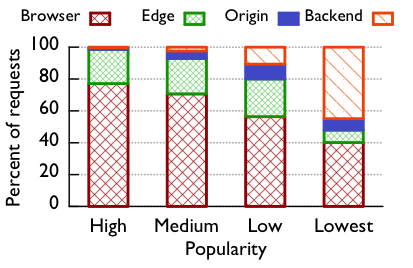
Caches derive most of their utility from serving the most popular content many times. To quantify to what degree this was true for the Facebook stack, we split photos up into popularity groups. Group “high” has the 1,000 most popular photos, group “medium” the next 9,000 most popular photos, group “low” the next 90,000 most popular photos, and group “lowest” the least popular 2.5 million photos in the subset of photos we traced. Each of these groups represents about 25% of user requests. This graph shows the percent of requests served by each layer for these four groups.

As expected, the browser and edge caches are very effective for the most popular photos in our trace and progressively less effective for less popular groups. The origin cache’s largest effect is seen for popularity group low, which also agrees with our intuition. More popular photos will be effectively cached earlier in the stack at the browser and edge layers. Less popular photos are requested too infrequently to be effectively cached.
Larger caches improve hit ratios
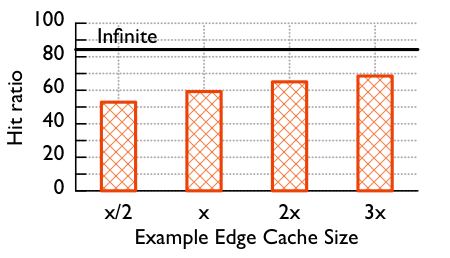
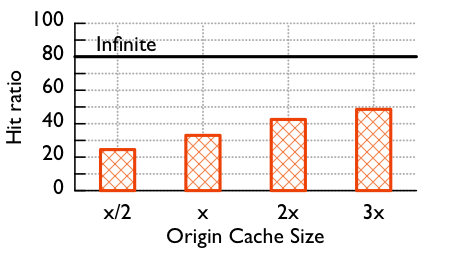
Unless your entire workload fits in the current cache, a larger cache will improve hit ratios — but by how much? To find out we took our trace to each layer and replayed it using a variety of different cache sizes. We share the results for one of the edge caches and the origin cache here.
Size X in the graph is current size of that edge cache. Doubling the size of the cache would significantly increase the hit ratio, from 59% to 65%. Tripling the size of the cache would further increase hit ratio to 68.5%.

The infinite line in the graphs shows the performance of a cache of infinite size, i.e., one that can hold the entire workload. It is an upper bound on the possible hit ratio and it shows us there is still much room for improvement.

The origin cache shows even more room for improvement from larger caches. Doubling the size of the origin cache improves hit ratio from 33% to 42.5%. Tripling increases that to 48.5%. The results for a cache of infinite size again demonstrate that there is still much room for improvement.
Advanced caching algorithms improve hit ratios
Larger caches are not the only way to improve hit ratios — being smarter about what items you keep in the cache can also have an effect. We used our trace to test the effects of using a variety of different caching algorithms. We published results for the following algorithms:
- • FIFO: A first-in-first-out queue is used for cache eviction. This is the algorithm Facebook currently uses.
- • LRU: A priority queue ordered by last-access time is used for cache eviction.
- • LFU: A priority queue ordered first by number of hits and then by last-access time is used for cache eviction.
- • S4LRU – Quadruple-segmented LRU. An intermediate algorithm between LRU and LFU (see paper for details).
- • Clairvoyant: A priority queue ordered by next-access time is used for cache eviction. (Requires knowledge of the future and is impossible to implement in practice, but gives a more accurate upper bound on the performance of an ideal caching algorithm.)
First, how do the different algorithms stack up at an edge cache?

While both LRU and LFU give slightly higher hit ratios than the FIFO caching policy, the S4LRU caching algorithm gives much higher hit ratios. Based on the data from our trace, at the current size the S4LRU algorithm would increase the edge cache hit ratio from 59.2% to 67.7%. At twice the current size, the trace data predicts it would increase cache hit ratios to 72.0%.
We see even more pronounced effects at the origin cache.

Based on our trace data, the S4LRU algorithm again gives the best results. (We tested quite a few different caching algorithms that are less common than LRU and LFU but did not publish results for them because S4LRU outperformed all of them in our tests.) It increases hit ratio from 33.0% to 46.9% based on our trace data. At twice the current size, our data predicts that S4LRU can provide a 54.4% hit ratio, a 21.4% improvement over the current FIFO cache.
More information
Qi Huang gave a talk on this work at SOSP. The slides and a video of the talk are on the SOSP conference page. There are also many more details in our paper.


