Improving energy efficiency and reducing environmental impact as we scale is a top priority for our data center teams. We’ve talked a lot about our progress on energy-efficient hardware and data center design through the Open Compute Project, but we’ve also started looking at how we could improve the energy efficiency of our software. We explored multiple avenues, including power modeling and profiling, peak power management, and energy-proportional computing.
One particularly exciting piece of technology that we developed is a system for power-efficient load balancing called Autoscale. Autoscale has been rolled out to production clusters and has already demonstrated significant energy savings.
Energy efficient load balancing
Every day, Facebook web clusters handle billions of page requests that increase server utilization, especially during peak hours.
The default load-balancing policy at Facebook is based on a modified round-robin algorithm. This means every server receives roughly the same number of page requests and utilizes roughly the same amount of CPU. As a result, during low-workload hours, especially around midnight, overall CPU utilization is not as efficient as we’d like. For example, a particular type of web server at Facebook consumes about 60 watts of power when it’s idle (0 RPS, or requests-per-second). The power consumption jumps to 130 watts when it runs at low-level CPU utilization (small RPS). But when it runs at medium-level CPU utilization, power consumption increases only slightly to 150 watts. Therefore, from a power-efficiency perspective, we should try to avoid running a server at low RPS and instead try to run at medium RPS.
To tackle this problem and utilize power more efficiently, we changed the way that load is distributed to the different web servers in a cluster. The basic idea of Autoscale is that instead of a purely round-robin approach, the load balancer will concentrate workload to a server until it has at least a medium-level workload. If the overall workload is low (like at around midnight), the load balancer will use only a subset of servers. Other servers can be left running idle or be used for batch-processing workloads.
Though the idea sounds simple, it is a challenging task to implement effectively and robustly for a large-scale system.
Overall architecture
In each frontend cluster, Facebook uses custom load balancers to distribute workload to a pool of web servers. Following the implementation of Autoscale, the load balancer now uses an active, or “virtual,” pool of servers, which is essentially a subset of the physical server pool. Autoscale is designed to dynamically adjust the active pool size such that each active server will get at least medium-level CPU utilization regardless of the overall workload level. The servers that aren’t in the active pool don’t receive traffic.
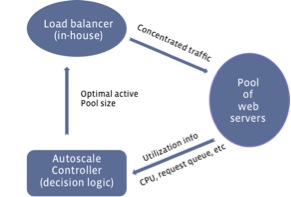
Figure 1: Overall structure of Autoscale
We formulate this as a feedback loop control problem, as shown in Figure 1. The control loop starts with collecting utilization information (CPU, request queue, etc.) from all active servers. Based on this data, the Autoscale controller makes a decision on the optimal active pool size and passes the decision to our load balancers. The load balancers then distribute the workload evenly among the active servers. It repeats this process for the next control cycle.
Decision logic
A key part of the feedback loop is the decision logic. We want to make an optimal decision that will adapt to the varying workload, including workload surges or drops due to unexpected events. On one hand, we want to maximize the energy-saving opportunity. On the other, we don’t want to over-concentrate the traffic in a way that could affect site performance.
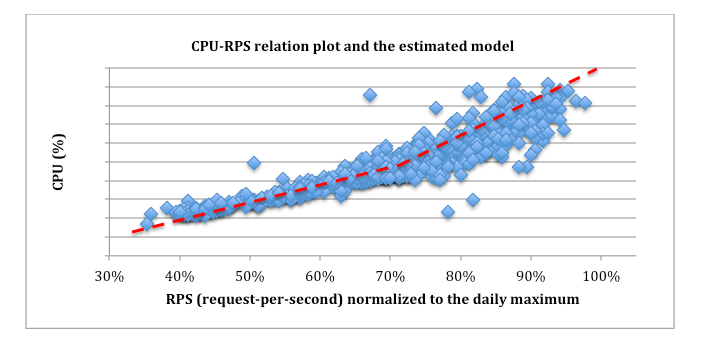
For this to work, we employ the classic control theory and PI controller to get the optimal control effect of fast reaction time, small overshoots, etc. To apply the control theory, we need to first model the relationship of key factors such as CPU utilization and request-per-second (RPS). To do this, we conduct experiments to understand how they correlate and then estimate the model based on experimental data. For example, Figure 2 shows the experimental results of the relationship between CPU and RPS for one type of web server at Facebook. In the figure, the blue dots are the raw data points while the red dashed line is the estimated model (piece-wise linear). With the models obtained, the controller is then designed using the classic stability analysis to pick the best control parameters.
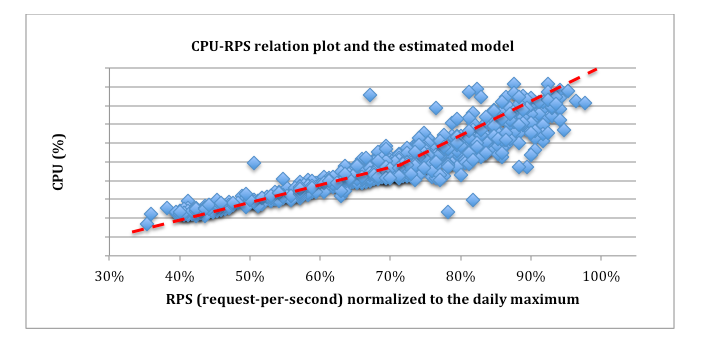
Figure 2: Experimental results of the relationship between CPU and RPS for one type of web server; the red dashed line is the estimated piece-wise linear model
Deployment and preliminary results
Autoscale has been deployed to production web clusters at Facebook and has so far proven to be successful.
In the current stage, we’ve decided to either leave “inactive” servers running idle to save energy or to repurpose the inactive capacity for batch-processing tasks. Both ways improved our overall energy efficiency.
Figure 3 shows the results from one production web cluster at Facebook. The y-axis is the normalized number of servers put into inactive mode by Autoscale during a 24-hour cycle. The numbers are normalized by the maximum number of inactive servers, which occurred around midnight. Also, as we expected, none of the servers in this cluster could be put into inactive mode around peak hours.
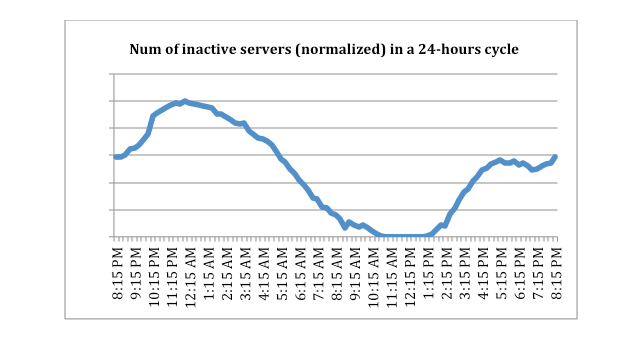
Figure 3: Normalized number of servers in a web cluster put into inactive mode by Autoscale during a 24-hour window
In terms of energy savings when putting inactive servers into power saving mode, Figure 4 shows the total power consumption for one of our production web clusters – the normalized power values relative to the daily maximum power draw. The red line is the best we could do without Autoscale. In contrast, the blue line shows the power draw with Autoscale. In this cluster, Autoscale led to a 27% power savings around midnight (and, as expected, the power saving was 0% around peak hours). The average power saving over a 24-hour cycle is about 10-15% for different web clusters. In a system with a large number of web clusters, Autoscale can save a significant amount of energy.
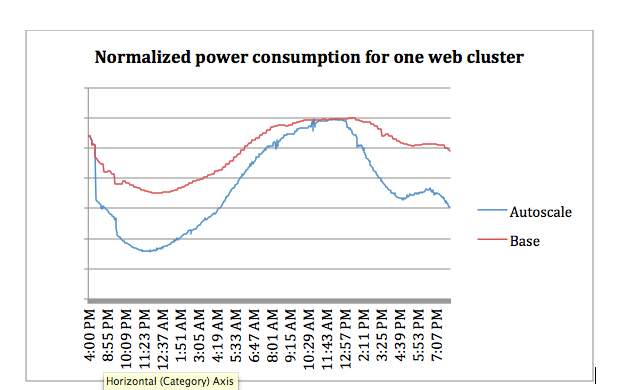
Figure 4: Normalized power consumption for a production web cluster with and without Autoscale
Next steps
We are still in the early stages of optimizing our software infrastructure for power efficiency, and we’re continuing to explore opportunities in different layers of our software stack to reduce data center power and energy usage. We hope that through continued innovation, we will make Facebook’s infrastructure more efficient and environmentally sustainable.
Special thanks to all contributors to Autoscale at Facebook.
