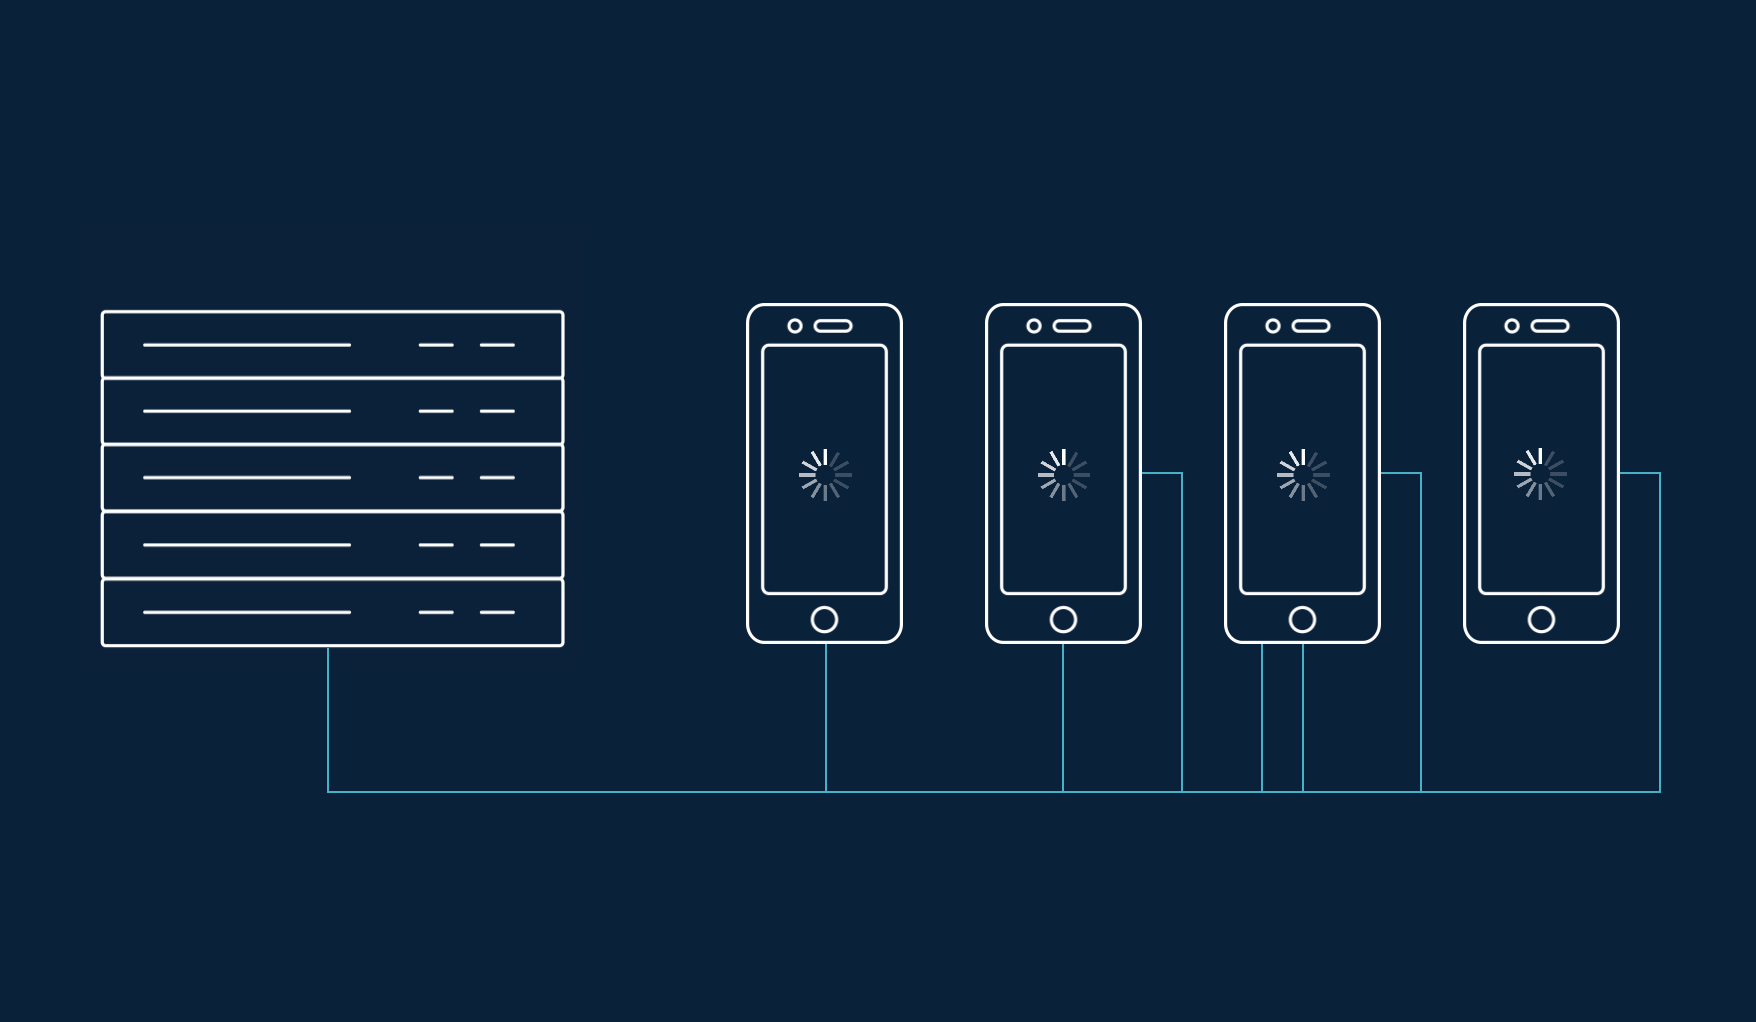
As engineers, we all hate regressions. There’s no getting around them in complex mobile apps, so we built CT-Scan, a performance monitoring and prediction platform, to help us understand the performance implication of a code change and ultimately decrease the number of regressions we have to deal with.
The following is a glimpse of some of the challenges we face at Facebook:
- We have thousands of changes each week on each mobile platform.
- Given the complexity of the app, it is relatively easy for a seemingly innocuous change to slow down an interaction, or use more data, memory, or battery.
- We care about app speed, data usage, and battery efficiency at Facebook.
- We iterate at a very fast pace. We want to build a system to maintain or improve our development speed while minimizing the number of regressions in dimensions of perf, such as speed, data usage, battery consumption, and memory footprint.
We started this work in late 2013, and by the end of 2014, we had built a highly automated system that prevented hundreds of perf regressions. Here’s how we approached building this tool.
Design principles
At Facebook, we believe in using data to find and solve performance issues. The design of this platform reflects that belief — detection and analysis are the focus of each stage of the release life cycle:
- Pattern detection: In a simple way, we want to capture the metrics that matter in the right form, perform statistical analyses, and possibly apply some machine-learning techniques to predict any potential issues.
- Diagnostics: Once we detect potential issues, we need to gather more detailed data to pinpoint the root causes, making the findings actionable to engineers.
The system can be viewed from two dimensions: life cycle and resolution process. On the life-cycle dimension, we have development, staging, and production. On the resolution-process dimension, we have detection and analysis.

The above can be illustrated by a simple but real example. If we point out to an engineer that there’s a memory increase after a certain code change, it may not be clear to him or her what to do about it. But if we point out that the increase is from the allocation of a certain object type in a certain call stack, the engineer may be able to take action quickly.
In practice, performance issues can be detected in either a lab environment or the real world. Both environments have pros and cons. In the lab, it is difficult to build a controlled environment to reasonably mimic the real world, so catching most perf issues and predicting perf wins before they make it out into the wild is harder. Data that’s gathered in the real world is truer than data gathered in the lab, but the signals can be very noisy. This can make it more difficult to fix a problem or more difficult to figure out the root cause of an issue. It is also less desirable because it requires data collection from user devices.
We have worked hard on building tools for lab environments with a belief that such a system can catch most issues, if not all of them, and provide a significant benefit.
A monitoring and prediction system for release life cycles
Development
A sub system allows engineers to specify a revision (we support GIT and Mercurial), whether checked in or not, and desired configuration, such as device type and network condition, and schedule the experiments. The system runs an A/B test-style experiment — with and without the revision — and notifies the engineers of the results once it is complete. A few key challenges here are time to feedback, prediction accuracy, and data presentation.
Perf experiments are generally computationally burdensome and time-consuming. To ensure that the system provides feedback to engineers quickly — usually within 30 to 60 minutes — it runs the likely affected key interactions in parallel, schedules jobs using a dynamic device pool, and tries to share as many artifacts as possible (e.g., the build of the base revision). One note here is that the sub system is not targeted to catch regressions or prove improvements in a comprehensive way because it runs for only a couple of key scenarios. Its biggest advantage is that it helps engineers iterate on changes quickly.
Prediction accuracy and data presentation are often closely related. Perf experiments are generally noisy, and it is particularly hard to be certain of changes in an A/B testing environment with quick turnaround time. Simple stats such as averages and medians (or P50, P75, P90, and so on) don’t usually paint a clear picture. So we show the distribution views and charts for data points from each repetition for all key metrics.
Staging
There are two phases in staging: continuous experiments and triaging runs.
When a change is checked into the main branch, the system does the heavy lifting by running all the possibly affected interactions with representative configurations, such as the combination of device type and network condition. We call this phase continuous experiments; that is, we run experiments continuously for effectively all revisions. Such experiments are burdensome. Even though we would like to run them on every revision, in reality it is more efficient to run them every N diffs. The goal is to pinpoint to a change whenever there’s a perf change, good or bad, so the system needs to be smart enough to figure out where there is a pattern change and automatically rerun for every revision within the range N. In addition, the range doesn’t need to be fixed; it can be adjusted based on the system load. For example, the system can increase and decrease N based on the queue length.
Triaging and tracking down regressions is labor-intensive but important in ensuring the performance of our apps. That’s where triaging runs come into the picture. As mentioned earlier, when a potential change is detected in the continuous runs, the system automatically runs experiments with profiling on for every revision inside the range. We enabled many profiling options in this phase (also available in the development phase) — for example, many changes that affect perf also change object allocations — so we built and enabled object allocation profiler for Android and scripted instrument profiling for iOS.
Production
Realistically, we cannot possibly detect all the perf changes in a controlled environment. We always need to be prepared to sample real-world perf counters when necessary, while making sure such sampling has minimal impact on people’s experience and their data usage. There are macro and micro means to such an end. We want is statistical significance, so we can dynamically determine a sample size to collect perf counters based on the desired data quality. It is both efficient and effective to randomly sample such counters at very low frequency, (e.g., during one out of 1,000 same interactions), on a random small percentage of people using the apps. This gives virtually zero amortized perf impact on anyone using the apps. Certainly, we want to write very efficient sampling code — for example, we can encode strings like the names of perf events into an integer and send a much lower number of bytes over the wire. When the data is in, we want to be able to plot it in real time and analyze the data online to most fully derive its value. We leverage many systems in Facebook infrastructure, such as Scribe and Scuba, to achieve these goals.
Build a scalable and extensible system
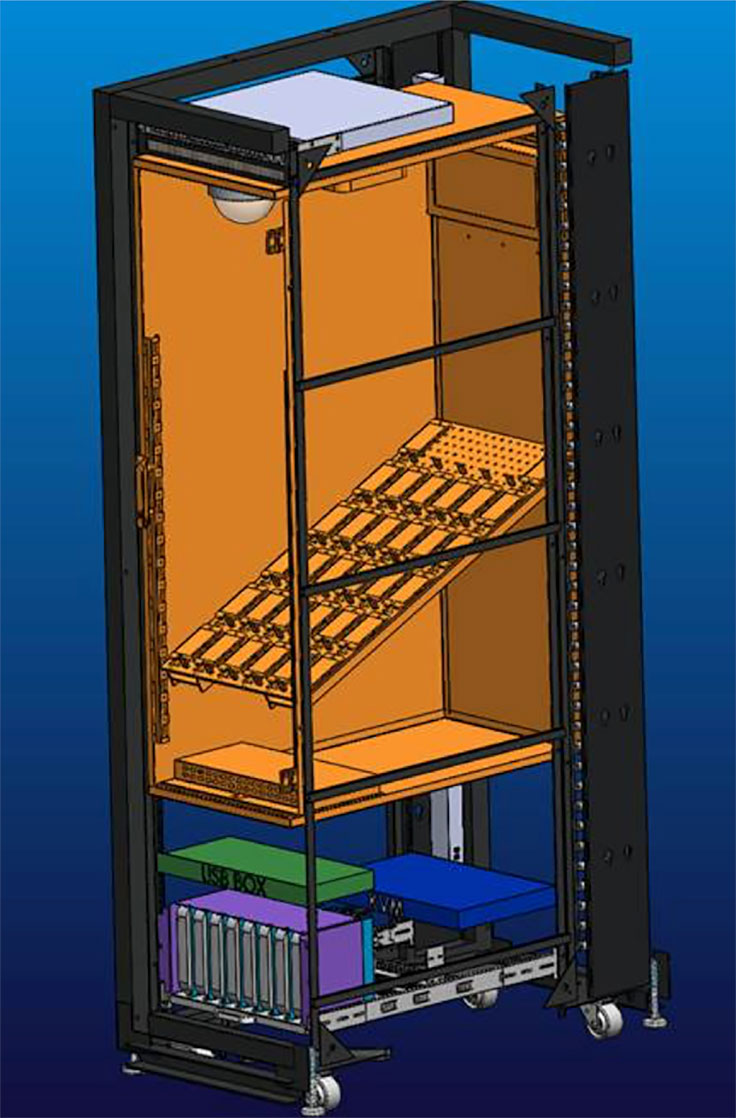
CT-Scan itself is a distributed system that scaled up during the last six months of 2014. Just to give some perspective, during that time period, it ran hundreds of thousands of continuous experiments, and thousands of diagnostic and profiling runs, and it prevented hundreds of regressions at different scales. This is just the start. To better scale and extend, we built a zookeeper-based scheduling and coordination service, and added service monitoring, because any failure in the system could significantly hinder developer efficiency. In addition, we built a device lab to support our perf experiments. We are currently designing and building a mobile device rack, which we plan to mass-deploy into our data centers. You can see an example rendering of this rack below.

Building a sophisticated system for mobile perf experiments is a long and rewarding challenge. There are many problems yet to be solved, including how to better control the environment end to end, and how to make perf tests in the lab representative enough for the real world. We’re excited to tackle them.


