
Our family of mobile apps is used by more than 2 billion people every month — on a wide variety of mobile devices. We employ rigorous code review and testing processes, but, as with any system, software bugs still sometimes slip through and may even cause our apps to crash. Resolving these crashes and other reliability issues in a timely manner is a top priority. To help us respond as quickly as possible, we have been creating a collection of services that use machine learning (ML) to aid engineers in diagnosing and resolving software reliability and performance issues. As part of this collection, we recently implemented continuous contrast set mining (CCSM), an anomaly-detection framework that uses contrast set mining (CSM) techniques to locate statistically “interesting” (defined by several statistical properties) sets of features in groups. A novel algorithm we’ve developed extends standard contrast set mining from categorical data to continuous data, inspired by tree search algorithms and multiple hypothesis testing. Our model is more than 40 times faster than naive baseline approaches, enabling us to scale to challenging new data sets and use cases.
The reliability problem
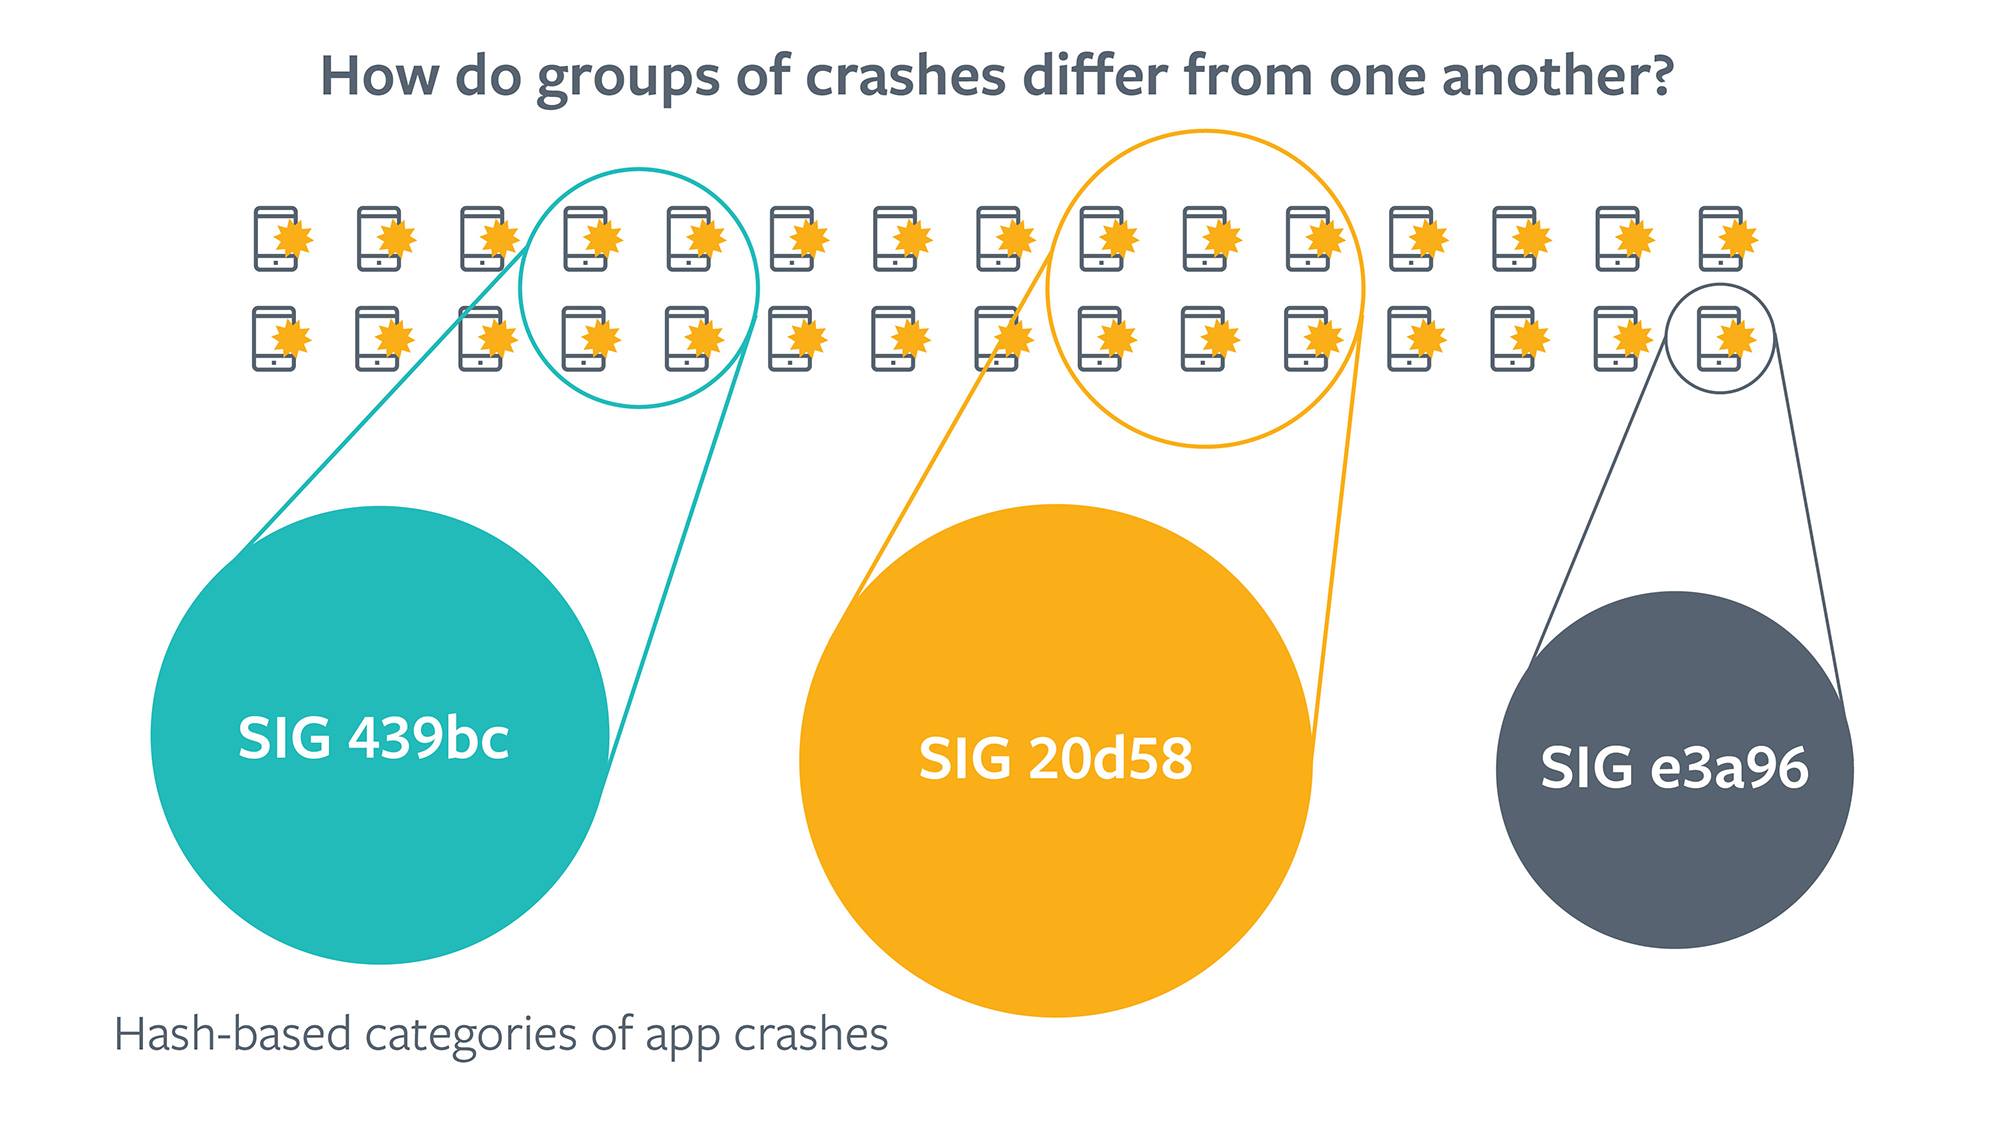
Debugging field crashes is no simple task. Any system operating at scale must handle a substantial volume of bug reports every day. Our engineers use systems to monitor and triage the bug reports logged across all our apps. Debugging crashes is a manually intensive process that requires deep domain expertise and close inspection of trace and code contents, often under time constraints. When a mobile client crashes, the device logs a generated crash report. A categorizer automatically groups similar crashes together and generates a unique signature (SIG) for each group. Each SIG links to an internal issue tracker system, where developers monitor crash spikes, create tasks, and discuss issues.
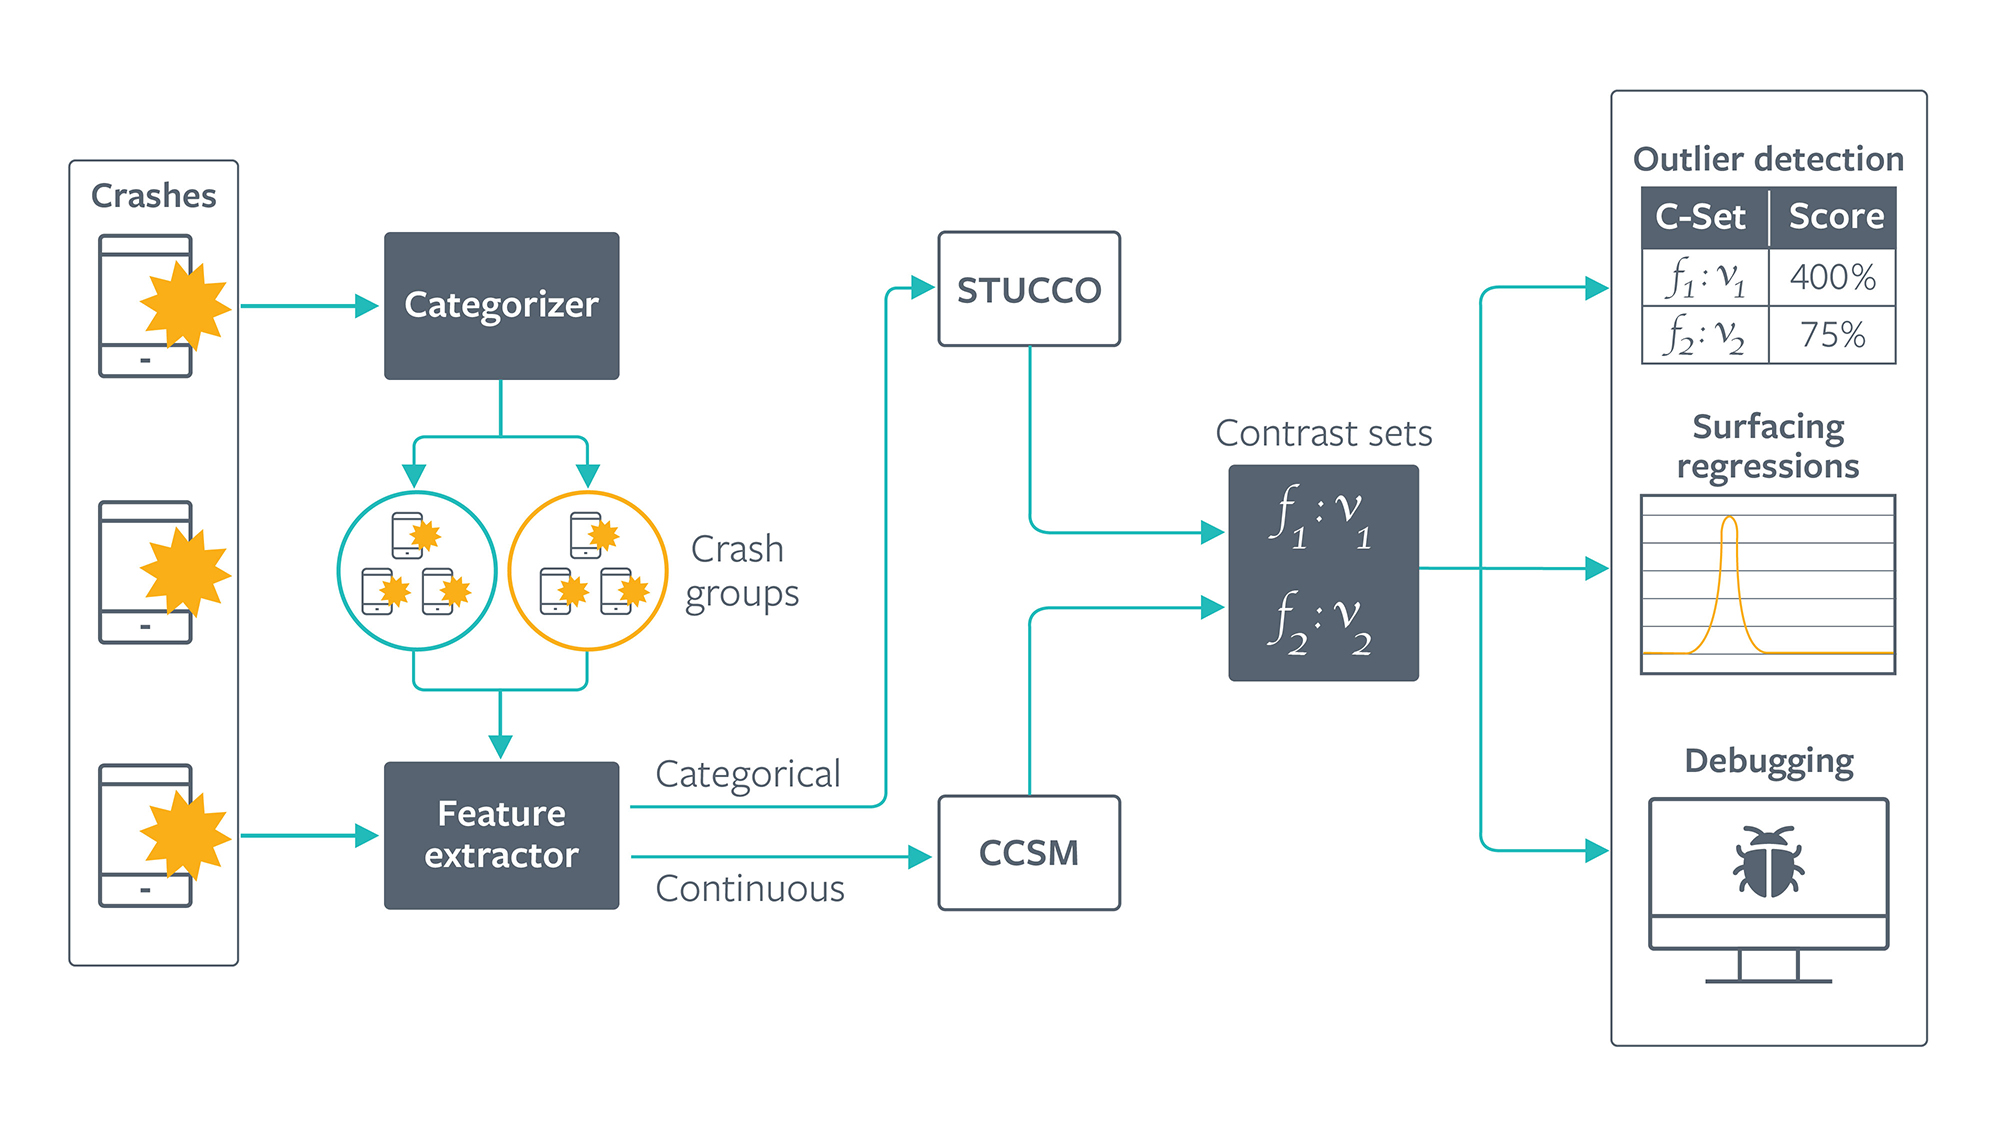
Developers who are trying to resolve a group of crashes often want to know what distinguishes that group from others. For instance, does this group occur more often in devices with model X and build version Y? Or, does this group occur disproportionately for users from country A? In other words, developers want to better understand the cause and effect. To help engineers debug crashes, we extract anonymized features from the crash report, such as the device OS or the build number.
We want to generate insights that point to the root cause of the crash. One way to do so is to run standard statistical tests on sample distributions of features in groups of crashes. For example, we could test if crashes from country A are likely to appear more frequently in one group of crashes than in others. However, there are hundreds of possible feature-value pairs, and hundreds of thousands of valid feature combinations. It isn’t feasible to investigate all feature sets. Furthermore, our crash data includes many dimensions of features, with a mix of categorical, discrete, and continuous values. Common statistical tests don’t reveal patterns involving interactions with multiple features, which are valuable debugging hints.
A contrast set mining algorithm
CSM provides a scalable, robust way to generate human-readable insights on high dimensional crash data. The goal of CSM is to find statistically meaningful differences between groups. A candidate contrast set is a set of key-value pairs, where the key is a database field and the value is one of a range of values that field can take on, e.g., country=IN. Our CSM model takes in crash features as input, runs statistical analysis on hundreds of thousands of feature combinations, and outputs contrast sets for each group of crashes.
For a contrast set X and group G, the support S(X,G) is the percentage of vectors in group G for which the contrast set X is true. A contrast set is “interesting” if its support differs meaningfully across groups. For differences in support to be meaningful, the contrast set must be both significant and large. More formally, a contrast set must satisfy two conditions:
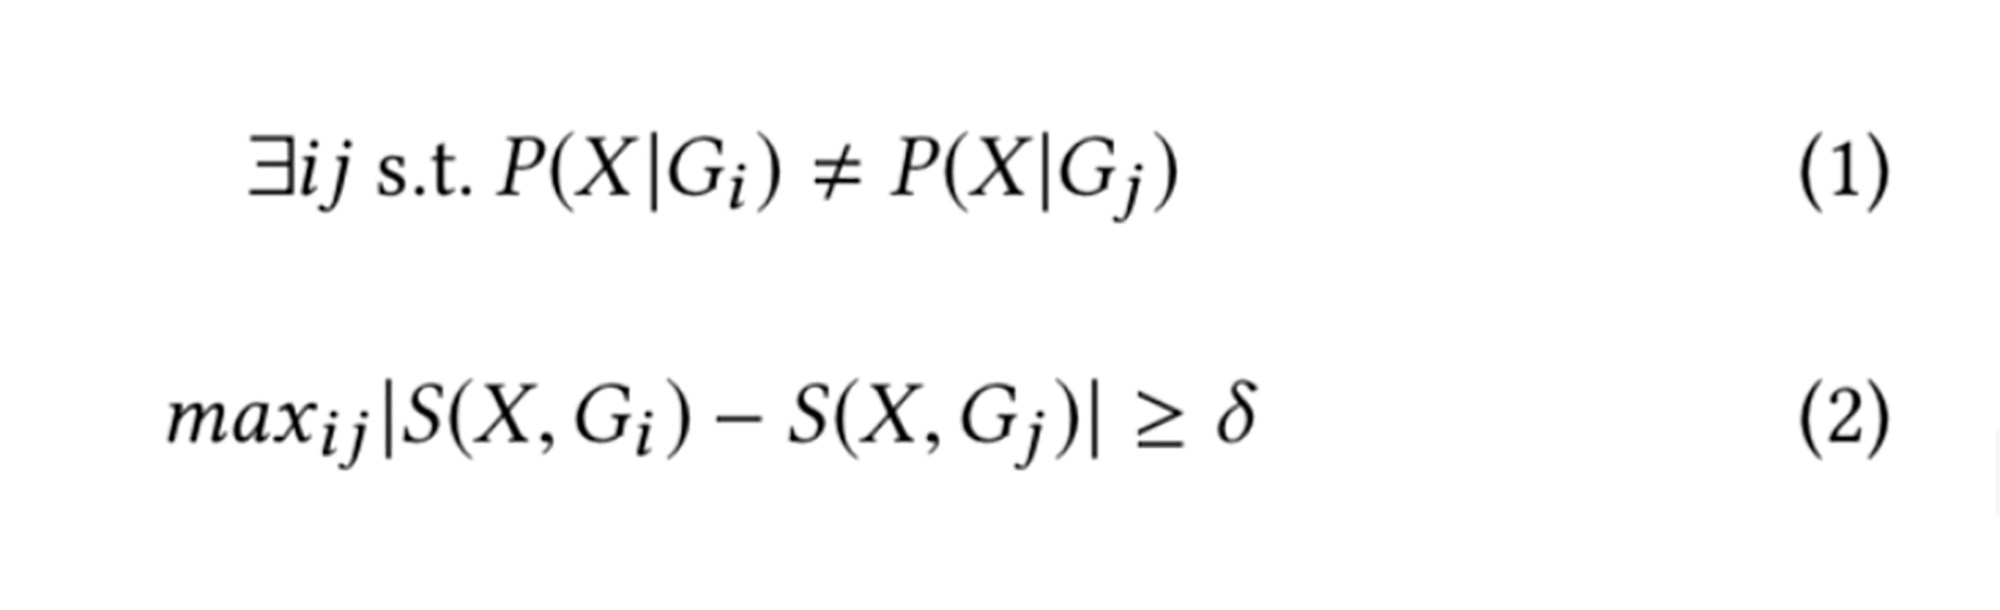
Where P(X|Gi) is the likelihood of observing set X for group Gi and is the user-defined minimum support difference. Equation (1) tests a contrast set for statistical significance, and equation (2) checks for largeness, i.e., that the support of the contrast set differs by a certain threshold for at least two groups.
To efficiently traverse the search space of feature combinations, we cast the problem of mining contrast sets as a tree search problem. Starting with an empty root node, we enumerate all key-value pairs in the data set. Here are the initial candidates for an example data set with two columns (country, os_version) that each can take on two values.
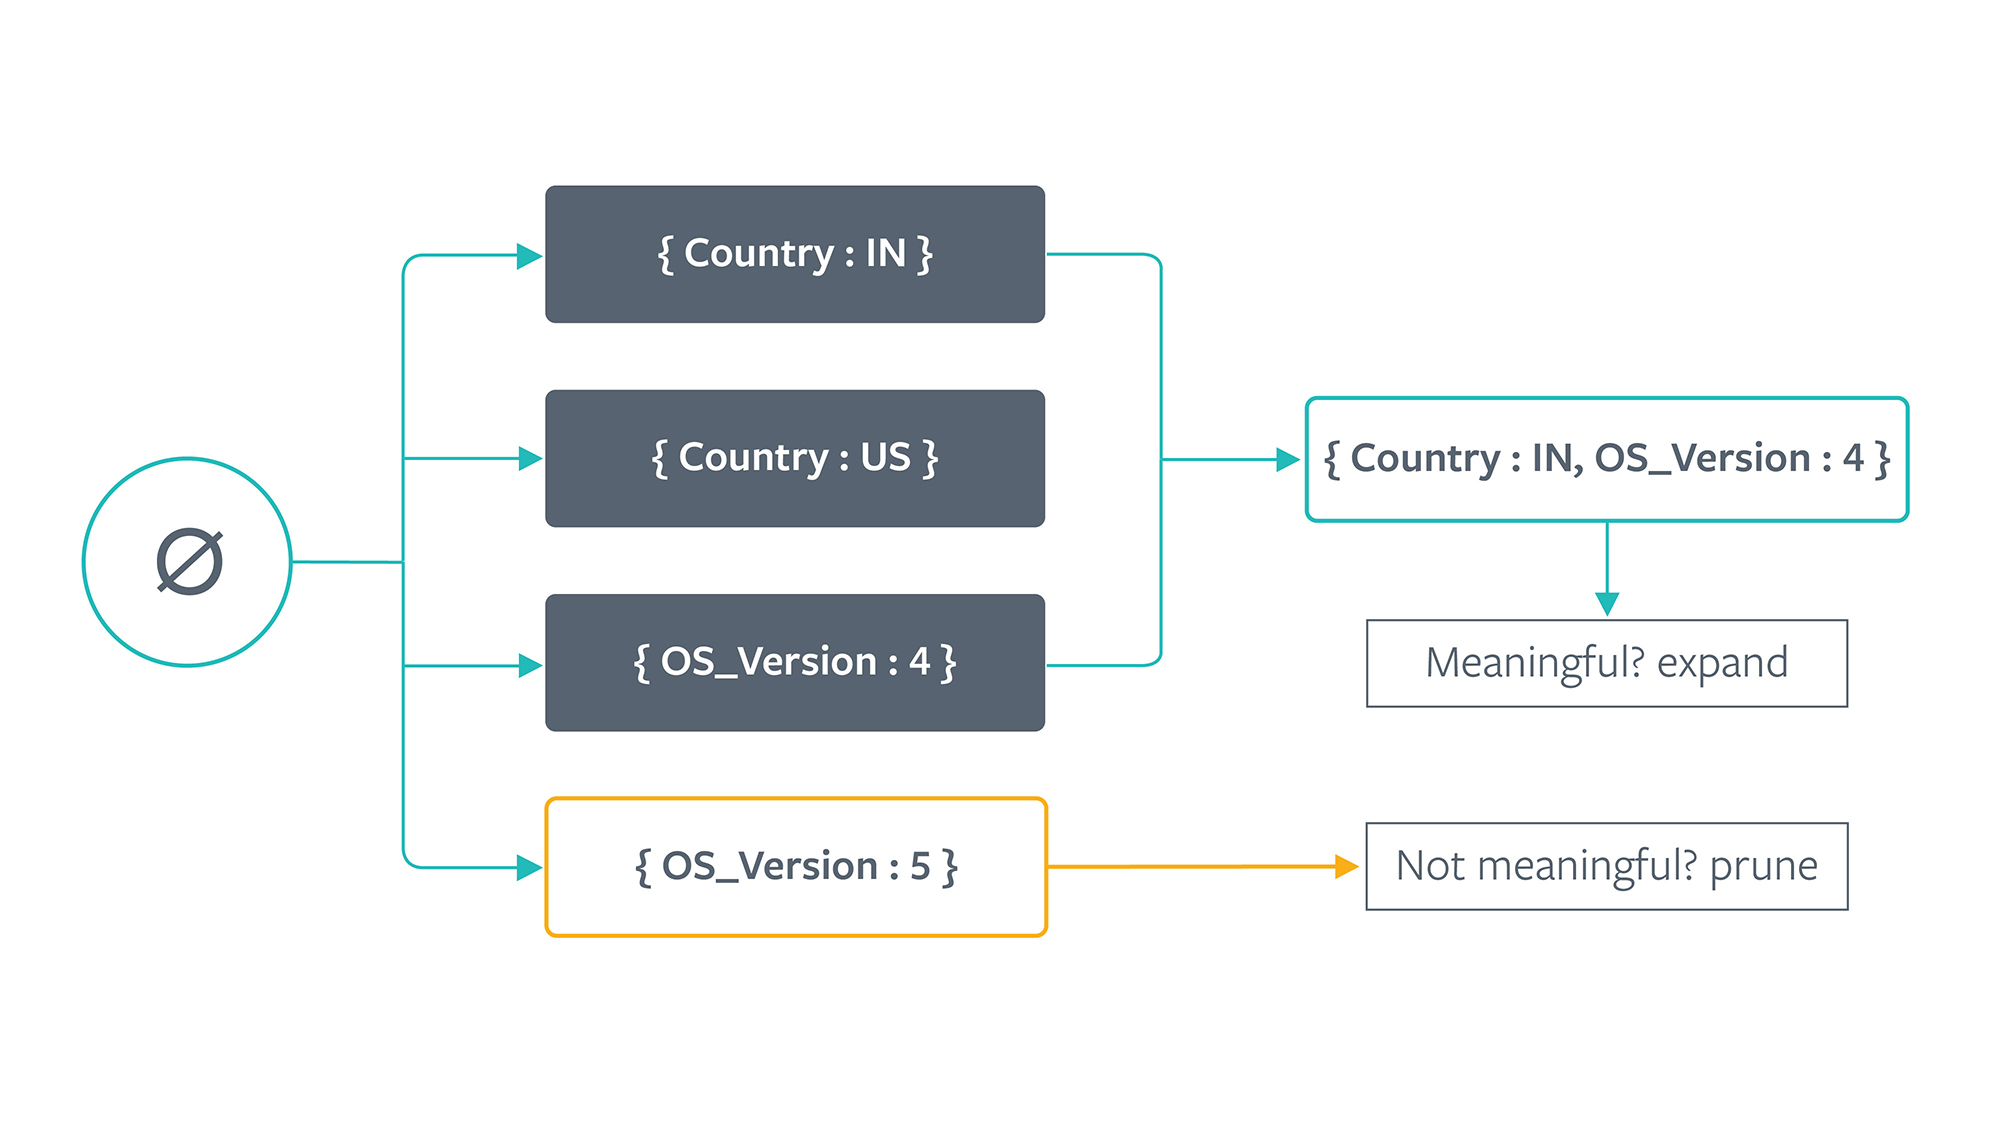
For each candidate node, we scan the data set and count the support for each group. We then examine whether the node is significant and large. In our implementation, a contrast set is statistically significant if it passes a two-way chi-squared test. The null hypothesis is that the support of a contrast set is equal across all groups, i.e., independent of group membership. The chi-squared test analyzes expected and observed frequencies, taking into account factors such as the number of observations, group size, and variance.
Nodes that fail either condition (1) or (2) are pruned. After testing all candidates in a given level, we generate children from the surviving nodes by combining sets of key-value pairs. For example, assuming no nodes are pruned, the children of contrast set {country : IN} are {country : IN, os_version : 4.0} and {country : IN, os_version : 5.0}. These generated child nodes become the new candidate set.
In addition to significant and large conditions, we implement several pruning techniques based on statistical properties and heuristics created by domain experts. We repeat the above process of testing and generating contrast sets until no new child nodes can be formed.
Contrast set mining works well for categorical data. However, real world data is often mixed — our crash data contains a mix of categorical, discrete, and continuous data. For our data mining model to be useful for many engineers, we needed to figure out a way to run contrast set mining on continuous features as well.
Continuous contrast set mining
We first present a common crash scenario where we only have continuous features, and CSM fails. When an out-of-memory (OOM) error occurs in buggy code, the OS kills the app and does not have enough memory to snapshot a stack trace. In these cases, developers use navigation logs to obtain hints for debugging. A navigation log is a sequence of anonymized app surfaces that a user interacted with leading up to the crash. This is an example of a navigation log where the user transitioned from the Feed surface to Friends:
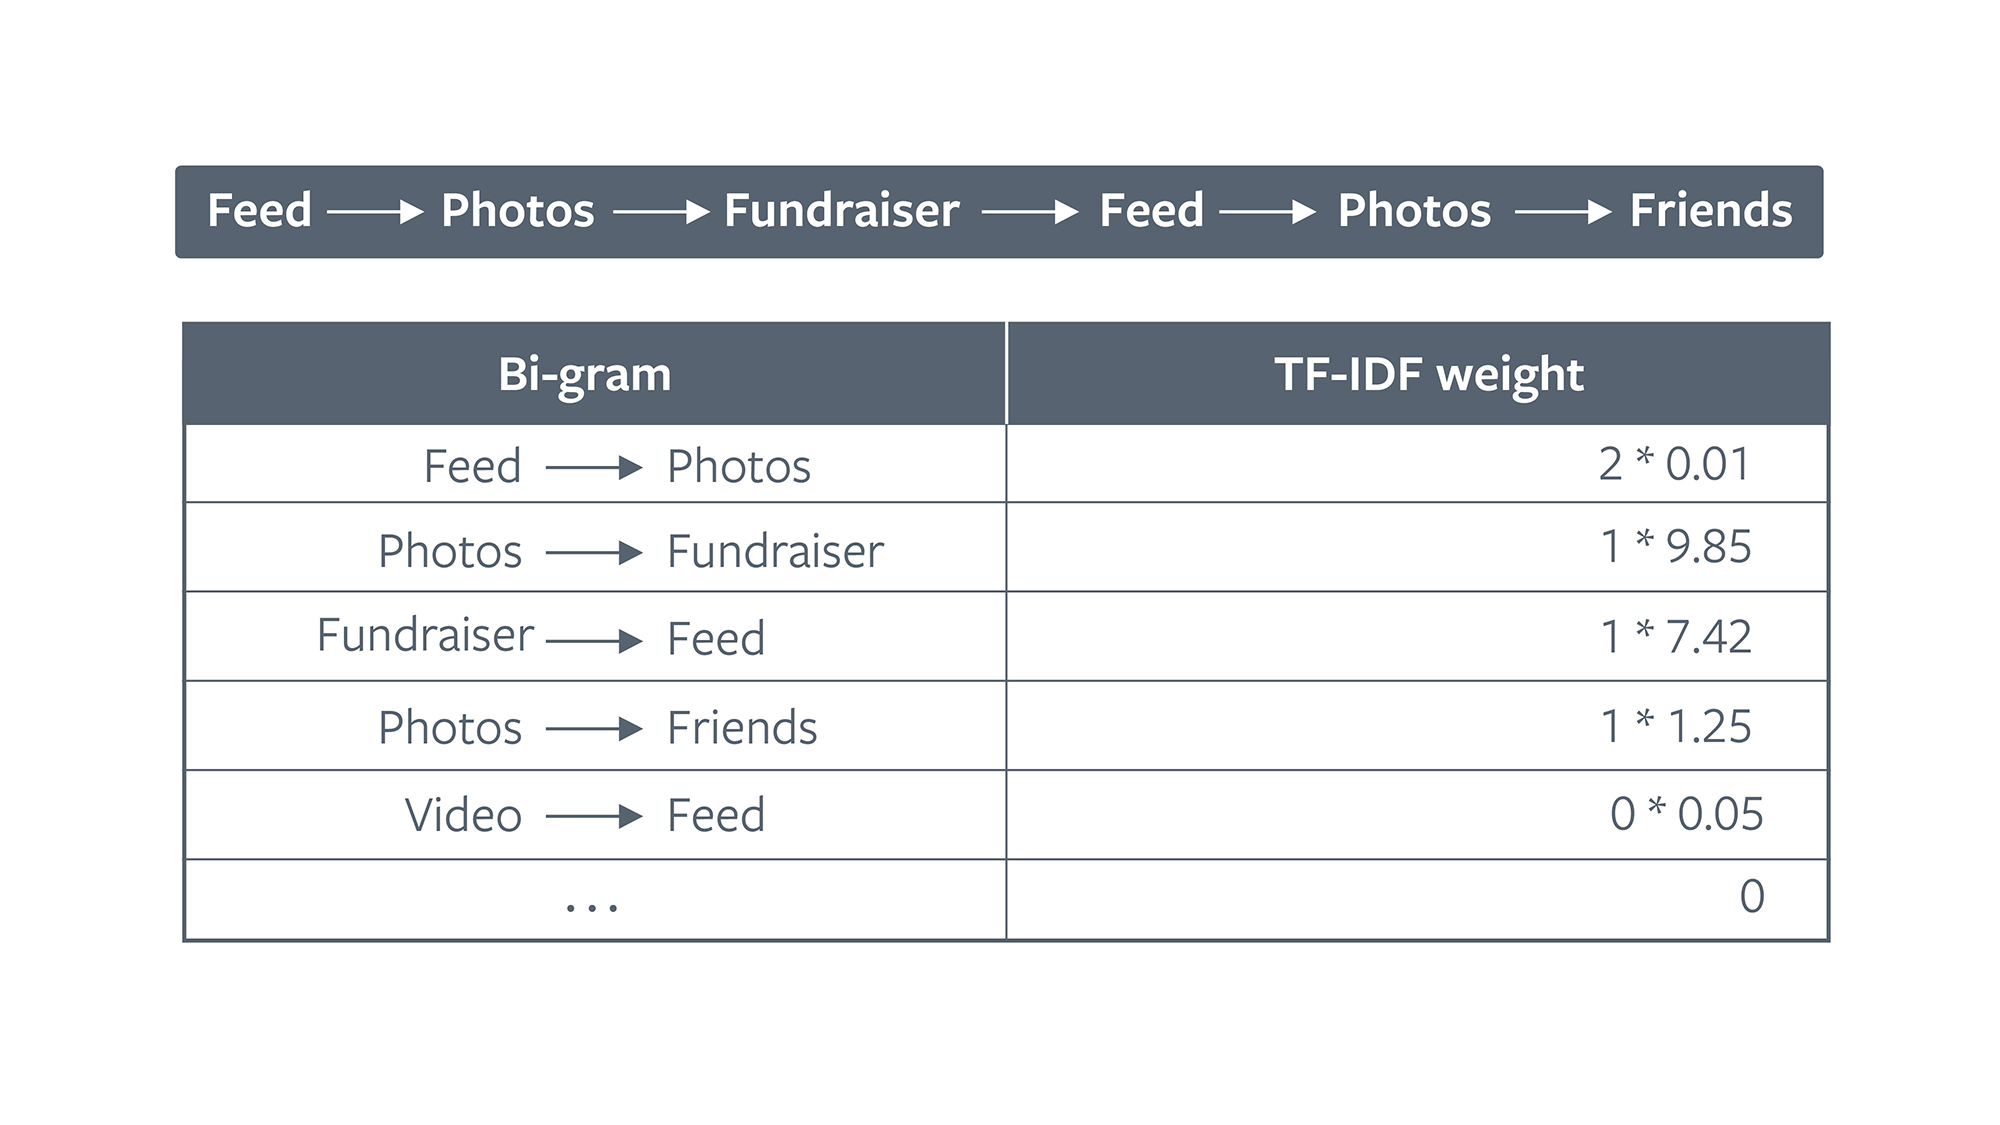
We extract bi-grams of source and destination endpoints of a single navigation event and embed them using TF-IDF. The TF-IDF weight of a bi-gram represents how often it appears in the entire corpus of navigation events as opposed to a particular log. A high weight for a bi-gram indicates that it is more important to this navigation log, i.e., less common in the entire corpus. Thus, each bi-gram in the corpus becomes a feature that can take on any positive continuous real value for each navigation log.
This gives us a way to measure bi-gram importances, but we still don’t know how to process these scores. The most popular way to deal with continuous variables is discretization, which buckets continuous data ranges into finite partitions. This has several drawbacks:
- Discretization greatly increases the number of candidate contrast sets. Each discretized bin results in a new candidate contrast set, and computation can become prohibitively expensive with a large number of continuous features.
- Discretizing continuous data may generate results that are difficult to interpret. Developers may not find specific intervals actionable, as the results may reflect the choice of cutoff points more than underlying patterns in the data.
- Any form of discretization leads to information loss, especially at the tails. This is especially true of strongly skewed distributions.
In light of these considerations, we developed a novel algorithm that directly applies contrast mining to continuous data. The continuous contrast mining algorithm adopts the same tree search framework, with modifications to reason about sets of continuous features.
In the continuous domain, our input again consists of a data set partitioned into groups (SIGs). A contrast set is either a single continuous variable or a set of continuous variables. We start by considering single continuous variables.
We define a contrast set to be significant or statistically significant if it passes a one-way ANOVA F-test. The null hypothesis of the one-way ANOVA F-test is that the average value of the contrast set is the same across all the groups. Then, we reject the null hypothesis if at least two groups have different average values for this contrast set. This is a natural counterpart to the chi-squared test used in the original contrast mining algorithm, which tests the null hypothesis that the percentage of the contrast set is the same across all the groups.
For a contrast set made up of continuous variables, we define it to be large or practically significant if there exist two groups such that the difference of the average values of the contrast set in these two groups is greater than some user-defined threshold δ. This definition also mirrors that in the categorical CSM algorithm, where a contrast set is defined to be large if the percentage difference of a contrast set in two groups is larger than some threshold.
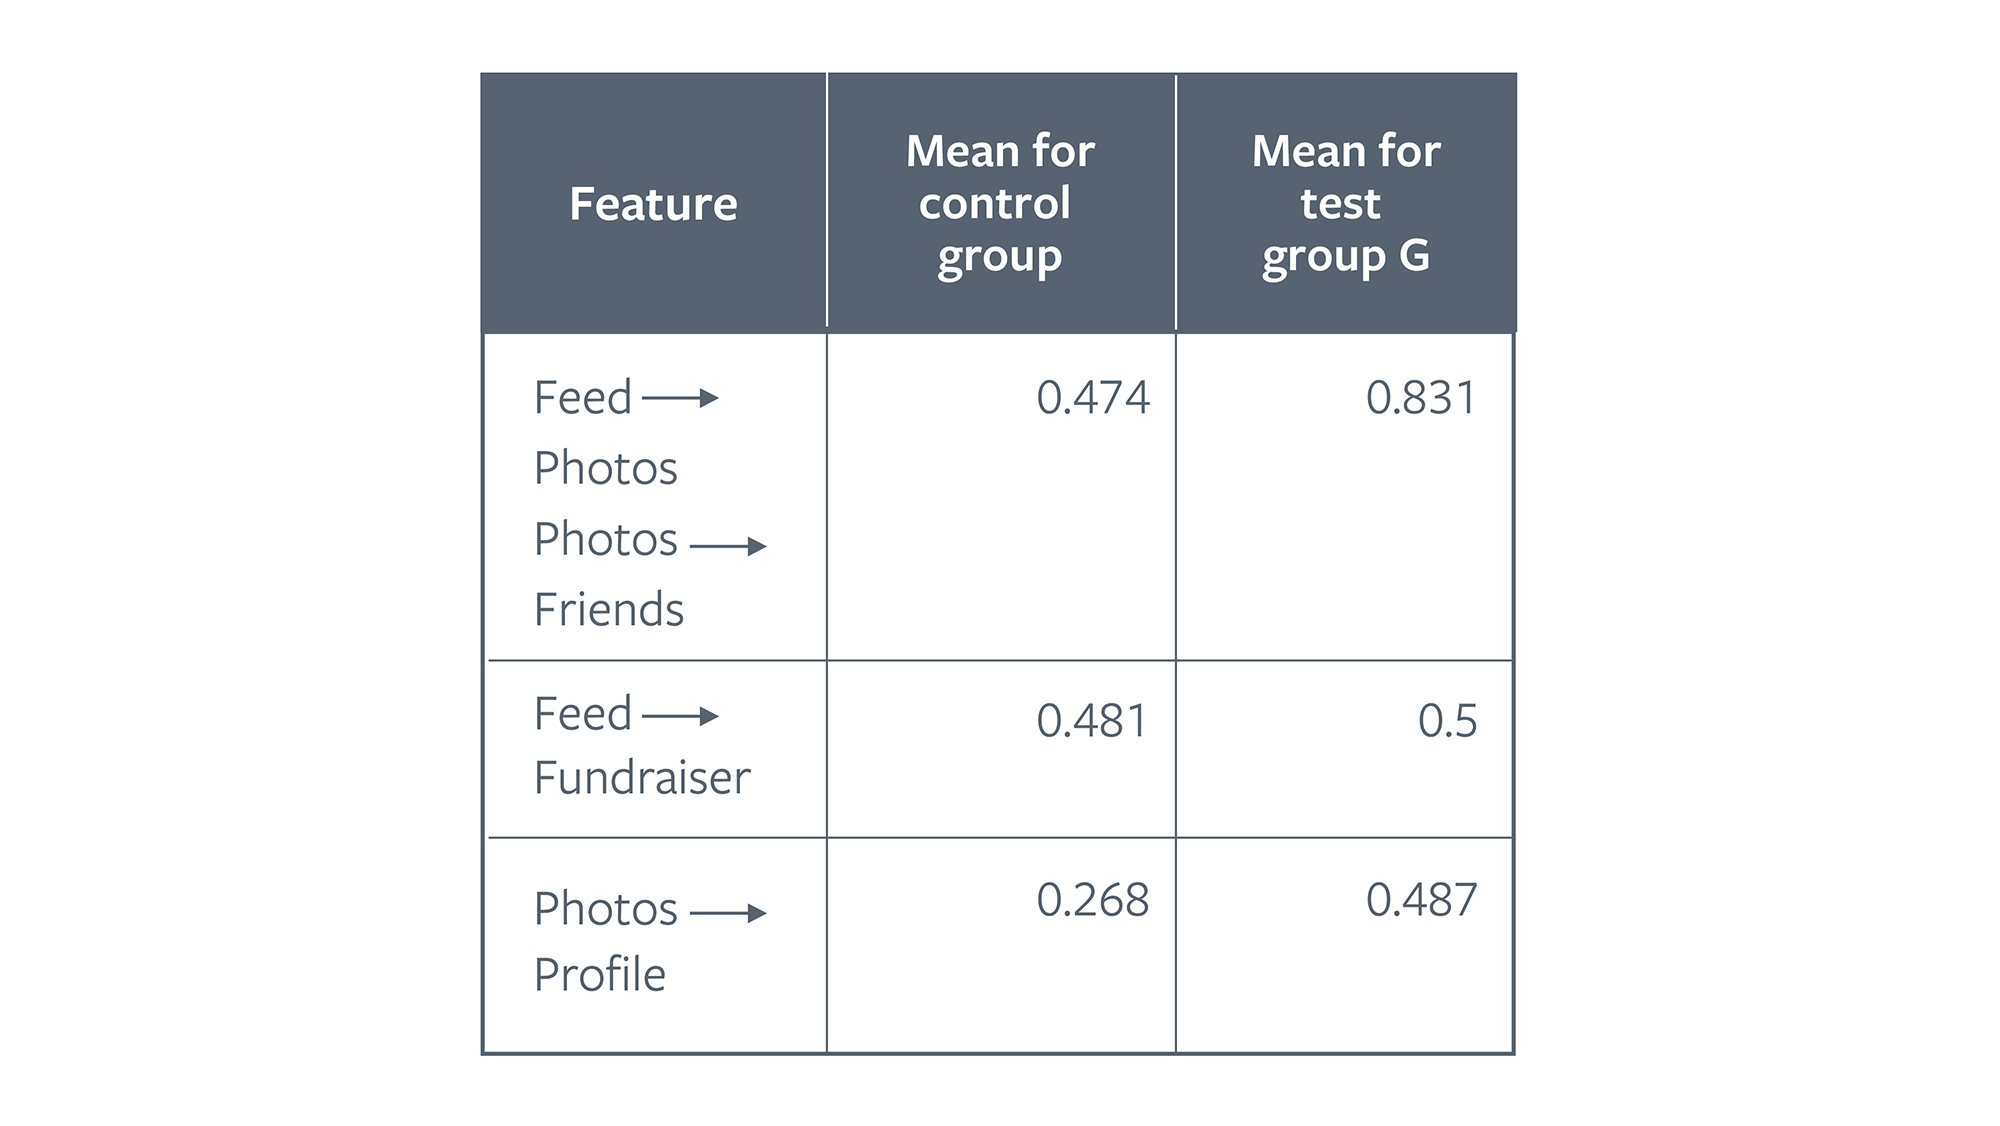
Let’s consider the following table computed for a group of crashes (group G) and a control group of navigation sequences for users who did not experience this crash. For each navigation sequence, we compare the mean importance score for that feature in group G with the mean score in the control group. Statistical testing revealed that {Feed → Photos, Photos → Friends} and {Video → Feed} are significant features for group G, but {Photos → Fundraiser} is not. This suggests that the issue is related to users interacting with the photos view.
 To improve usability, we define an anomaly score* used to rank contrast sets and a method to unify continuous and categorical contrast sets that mitigates bias. We also output confidence intervals to increase actionability for developers using our models.
* Based on Cohen’s d, a measure of effect size in the comparison between two means.
Applications
CCSM is able to process 60K crash reports in about eight minutes. This is over 40 times faster than simple discretization approaches, even with very few bins. CCSM has helped us surface important insights in a variety of situations, some of which are not possible to handle with standard CSM:
- Describing groups: Since SIGs do not have semantic meaning, contrast sets provide human-readable descriptions of groups of crash reports. In one case, contrast mining found poor network connection as an anomalous feature for a SIG. This confirmed a mobile engineer’s fix proposal based on the assumption that the network is slow.
- Root cause analysis: During a regression, developers want to generate detailed insights about specific SIGs. In one case, contrast mining correctly found that navigation to and from a module related to comments showed up consistently within the top five anomalous features. This is a case where continuous contrast mining makes it possible to analyze hard bugs due to its scalability to high dimensional data sets.
- New issue discovery: Contrast mining detected that a certain app build was highly anomalous and experiencing high crash rates. It’s difficult for humans to detect errors like this, in which the signal is diluted with failures spread across several SIGs.
Continuous contrast set mining opens up exciting possibilities for automated analysis of large data sets. Looking ahead, we want to help diagnose performance issues that are more difficult to detect but that cause negative experiences for our users. We believe that, in the future, machine intelligence and automation will simplify large parts of engineering workflows, allowing engineers to focus on more abstract tasks.
We would like to thank Yang Yu, Phuong Nguyen, Rushabh Shah, Saransh Bansal, and Stephen Fink for their contributions to this work.


