
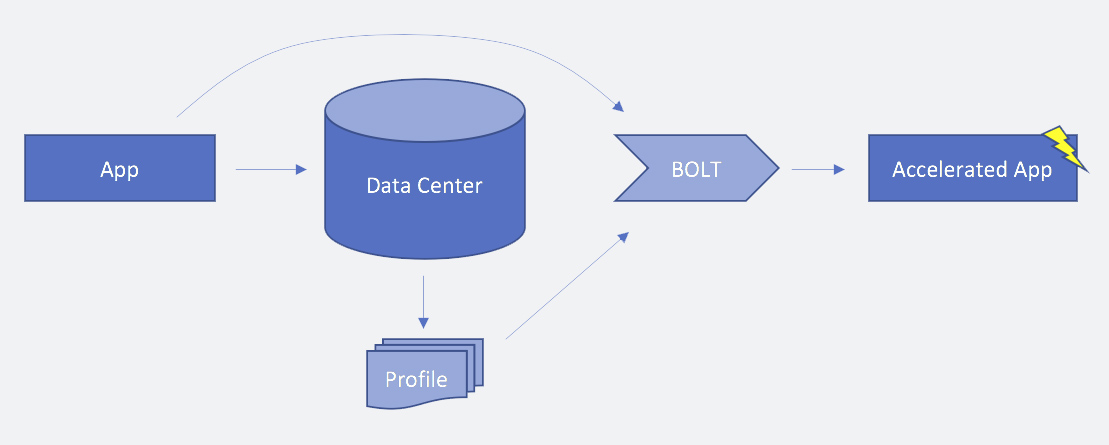
Highly complex services, such as those here at Facebook, have large source code bases in order to deliver a wide range of features and functionality. Even after the machine code for one of these services is compiled, it can range from 10s to 100s of megabytes in size, which is often too large to fit in any modern CPU instruction cache. As a result, the hardware spends a considerable amount of processing time — nearly 30 percent, in many cases — getting an instruction stream from memory to the CPU. To address this issue, which is commonly known as instruction starvation, we have developed and deployed BOLT, a binary optimization and layout tool. BOLT optimizes placement of instructions in memory, thereby reducing CPU execution time by 2 percent to 15 percent. Unlike previous tools to address instruction starvation, BOLT works with applications built by any compiler, including GCC or Clang. Today, we are open-sourcing BOLT so that engineers everywhere can use it alongside complementary technologies like AutoFDO to achieve performance gains for their apps.
Building a flexible tool to work with any compiler
Common techniques to fight instruction starvation include compiler PGO (profile-guided optimizations), which makes it easier for hardware to efficiently utilize its caching architecture, as well as manual annotation by an engineer. For manually inserted annotations, the application writer may know which code is most commonly executed, but this approach is not scalable, and the behavior of the code may evolve over time.
It can also be difficult to identify and prioritize parts of the code that are executed regularly, but not as frequently as other parts. In these cases, a common solution is to use PGO to run the application under typical load, gather its execution profile, and then feed that profile into the compiler that recompiles the program.
When this approach is combined with a whole-program mode, where the compiler can see all source files at once, it improves the overall code layout of the application and allows the compiler to make better decisions when applying a number of optimizations, especially inlining.
In practice, however, the PGO approach faces a number of limitations, both intrinsic and implementation-specific. Without the source code, no compiler has control over the code coming from assembly or from third-party libraries. It is also difficult to obtain and then apply the profile accurately during compilation. AutoFDO, a system to simplify real-world deployment of feedback-directed optimization, attempts to address this issue, but we found it was not the ideal tool to use with the C++ exception mechanism heavily used by HHVM, one of our main services here at Facebook. HHVM was already using __builtin_expect intrinsics throughout the source code to assist the compiler with the code layout, but we wanted a more scalable approach.
In seeking a solution, we wanted a flexible tool that would perform well on top of any state-of-the-art compiler, so we would have more options for evolving our systems in the future. Therefore, instead of modifying AutoFDO, we built a new system, BOLT, which works with different compilers, and even with link-time optimizations (LTO) and PGO/AutoFDO optimizations enabled.
Under the hood
We designed BOLT to satisfy three important requirements. It needed to be:
- Compatible with code generated by any compiler or a mixture of code from different compilers.
- Able to support any code that does not have source code available (such as vendor-supplied libraries).
- Able to support code manually written in assembly in order to optimize its layout.
In order for BOLT to perform a new code layout for an application, it has to reconstruct the control flow graph for the code. The task is similar to de-compilation, except we only have to find high-level constructs, such as branches with all possible source and destinations, and loops. We don’t have to perform other de-compilation tasks, such as local variables detection.
Internally, the application is represented as a set of functions operating on a set of data. We designed our own internal representation, which uses LLVM’s MCInst format for instructions.
We have very minimal requirements for the input. Our goal was to support Linux binaries. We started with the x86-64 instruction set and then added support for AArch64, and we expect to be able to extend BOLT to other architectures in the future.
For profile collection, we use sample-based profiling obtained by running the Linux perf tool. We can use either regular event samples or last branch records (LBR), which provide more context and precision.
Performance impact
When it was deployed to production, the first BOLT-accelerated version of HHVM showed a 3 percent performance improvement over code that was optimized coming from the compiler and had additional optimizations from our link-time function layout tool (HFSort). Since then, we have added more optimizations and improvements to BOLT, and, as a result, in many cases, it now accelerates HHVM by 8 percent. Overall results range from 2 percent to 15 percent for different services, depending on the underlying CPU architecture.
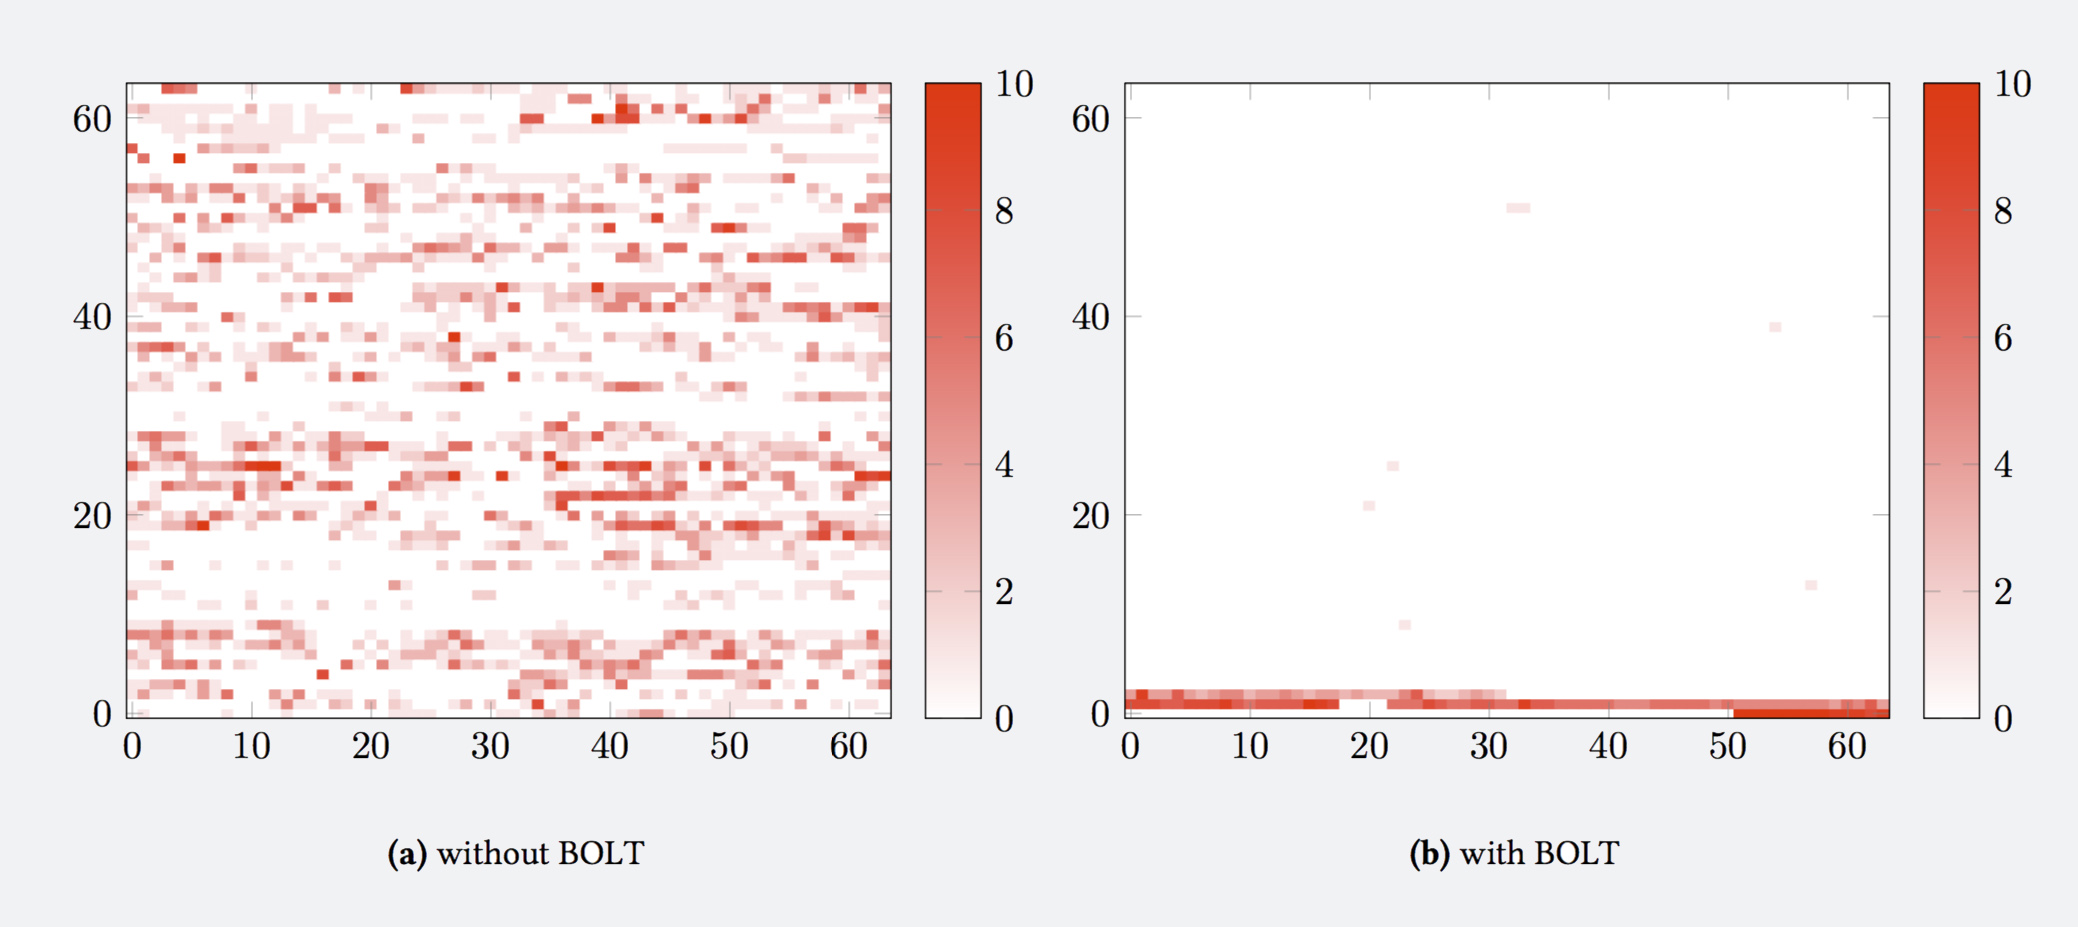
This heat map shows that the frequently executed code is isolated in a much smaller region than the original binary.
Finding opportunities for optimization
BOLT rearranges code inside functions based on their execution profile. Then the body of the function can be split based on how frequently the code is executed. Once this is done, the final step is to perform an optimal layout of the hot chunks of code depending on the call graph profile.
Peculiarities of modern hardware create more opportunities to optimize code layout beyond improvements with the instruction cache. One such opportunity was discovered when we noticed a 5 percent regression on an industry-standard bzip2 compression library. The regression was caused by a simple 1-byte shift in the instruction stream. We found that a pair of instructions could be folded internally by the CPU into a single micro-op for faster execution. This operation, called macro-fusion, allows the CPU to execute additional macro instructions per cycle. But it can’t happen if the second instruction is aligned at a cache line boundary (64 bytes), as was the case with an instruction from a pair inside the hottest loop of bzip2. We then modified the BOLT layout algorithm so that it can prevent such misshapenness and also detect and fix similar issues.
Beyond improving the code layout, BOLT performs a number of optimizations that utilize an application profile and exploit aspects of the input’s machine code. The list of optimizations includes advanced jump table placement, identical code folding, PLT optimization, and constant load elimination. We can also perform a basic inlining, as the compiler might have missed cases where the source code was not available, such as with assembly code. In general, we’ve focused on exploiting optimization opportunities that are not available to a conventional compiler toolchain.
The net effect of BOLT optimizations is best illustrated by the following figure indicating program stats after optimizations:

We are open-sourcing BOLT and will be happy to work with the community to help accelerate its applications. If you are running a large application that is CPU front-end bound — i.e., it experiences a significant amount of instruction cache and TLB misses — then BOLT will help address these bottlenecks.
We would like to express our gratitude to the LLVM community for building an amazing foundation of libraries that facilitated quick BOLT development.
Special thanks to Rafael Auler for helping write this post.


