- We’re introducing Zoomer, Meta’s comprehensive, automated debugging and optimization platform for AI.
- Zoomer works across all of our training and inference workloads at Meta and provides deep performance insights that enable energy savings, workflow acceleration, and efficiency gains in our AI infrastructure.
- Zoomer has delivered training time reductions, and significant QPS improvements, making it the de-facto tool for AI performance optimization across Meta’s entire AI infrastructure.
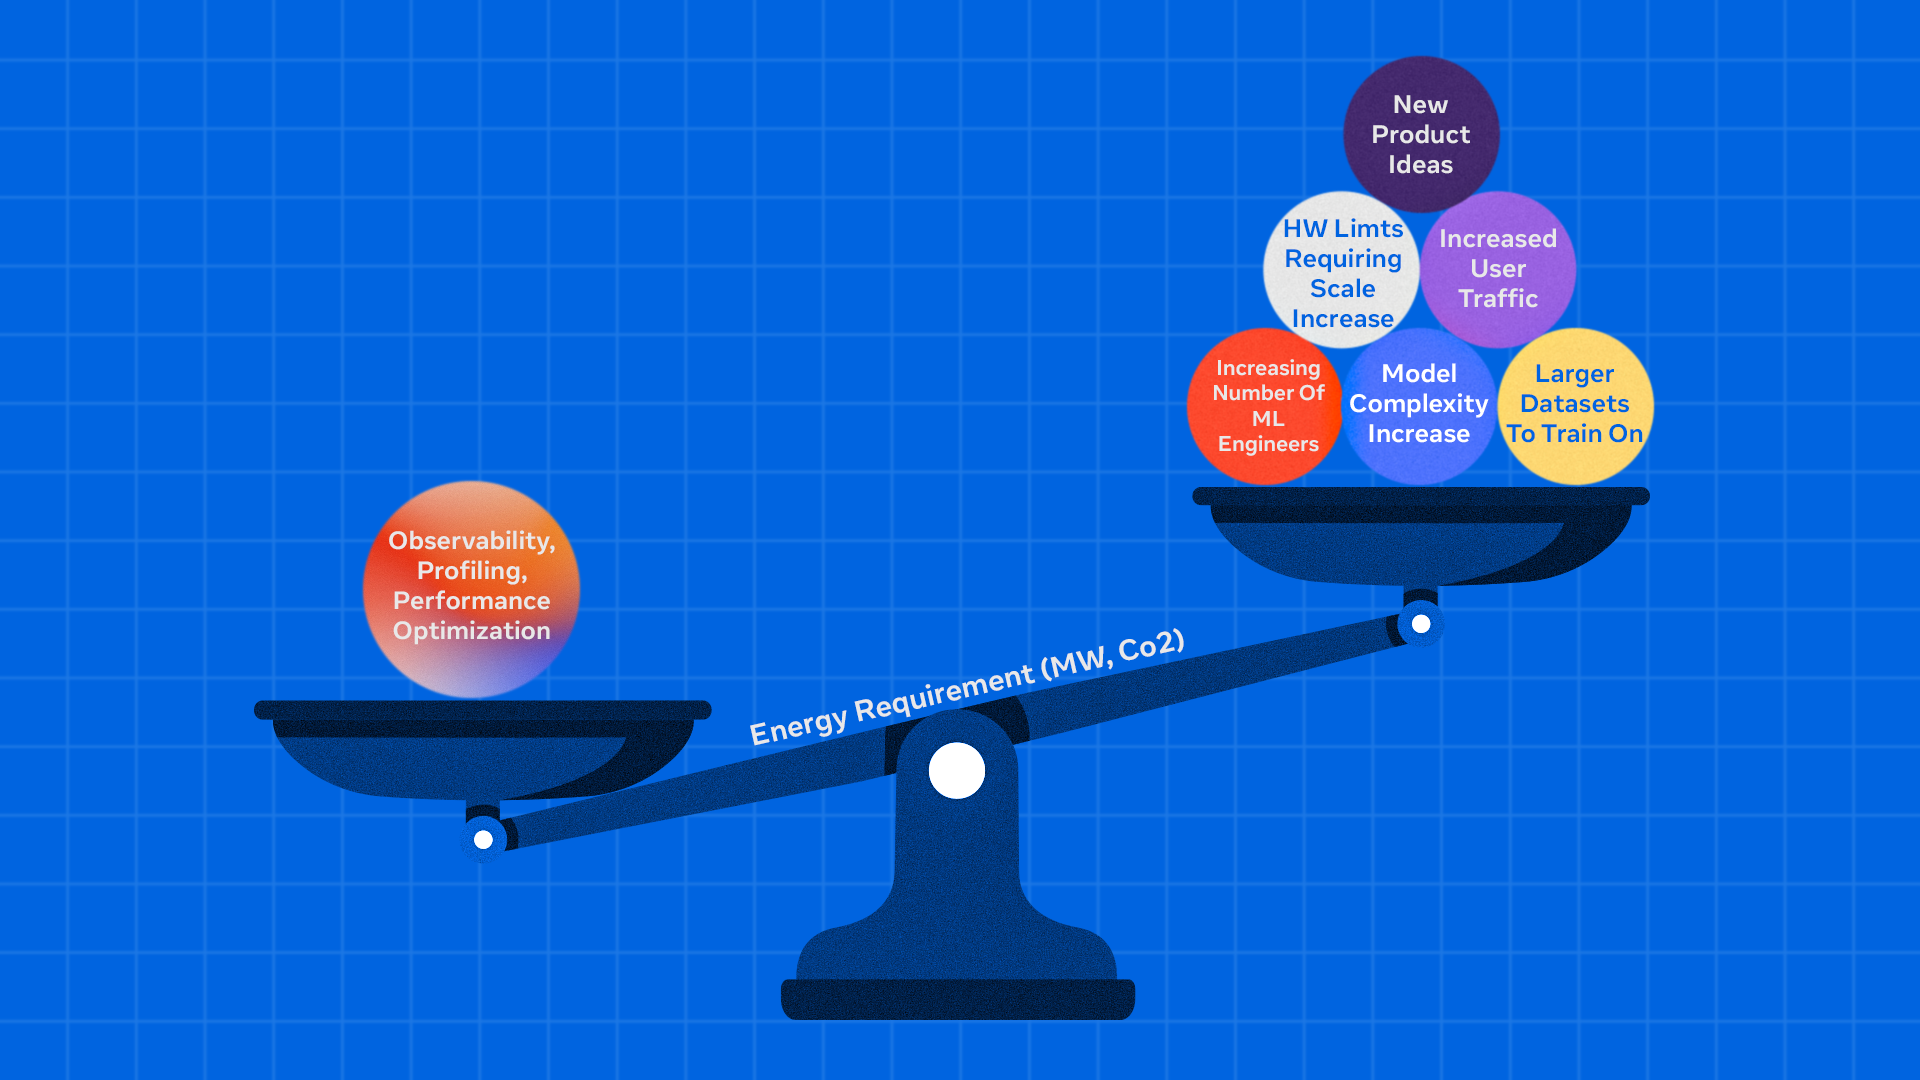
At the scale that Meta’s AI infrastructure operates, poor performance debugging can lead to massive energy inefficiency, increased operational costs, and suboptimal hardware utilization across hundreds of thousands of GPUs. The fundamental challenge is achieving maximum computational efficiency while minimizing waste. Every percentage point of utilization improvement translates to significant capacity gains that can be redirected to innovation and growth.
Zoomer is Meta’s automated, one-stop-shop platform for performance profiling, debugging, analysis, and optimization of AI training and inference workloads. Since its inception, Zoomer has become the de-facto tool across Meta for GPU workload optimization, generating tens of thousands of profiling reports daily for teams across all of our apps.
Why Debugging Performance Matters
Our AI infrastructure supports large-scale and advanced workloads across a global fleet of GPU clusters, continually evolving to meet the growing scale and complexity of generative AI.
At the training level it supports a diverse range of workloads, including powering models for ads ranking, content recommendations, and GenAI features.
At the inference level, we serve hundreds of trillions of AI model executions per day.
Operating at this scale means putting a high priority on eliminating GPU underutilization. Training inefficiencies delay model iterations and product launches, while inference bottlenecks limit our ability to serve user requests at scale. Removing resource waste and accelerating workflows helps us train larger models more efficiently, serve more users, and reduce our environmental footprint.
AI Performance Optimization Using Zoomer
Zoomer is an automated debugging and optimization platform that works across all of our AI model types (ads recommendations, GenAI, computer vision, etc.) and both training and inference paradigms, providing deep performance insights that enable energy savings, workflow acceleration, and efficiency gains.
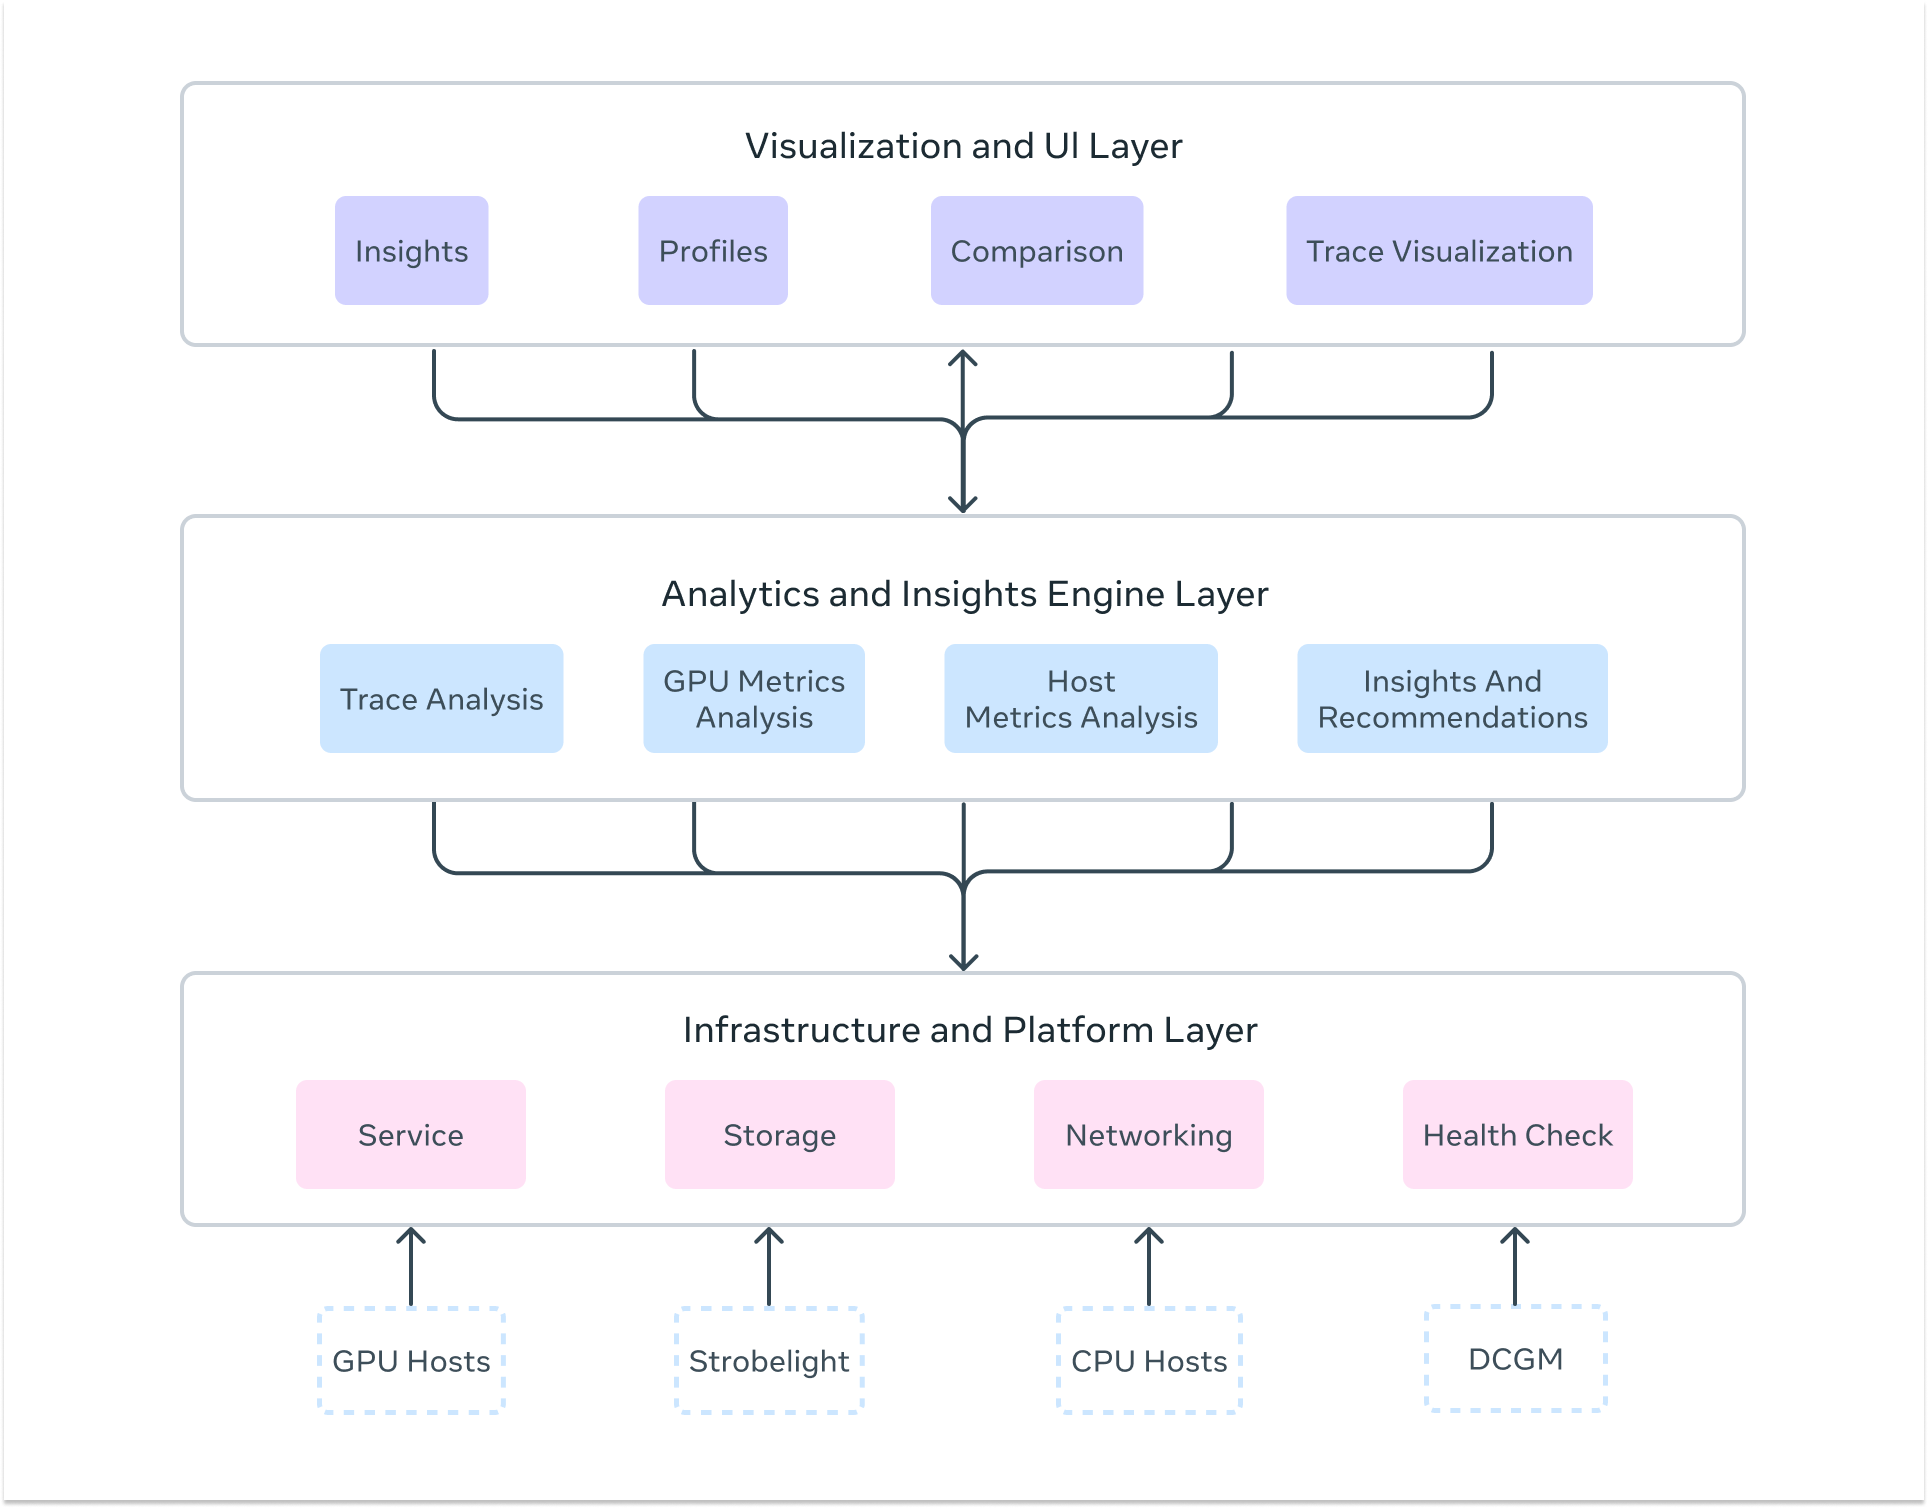
Zoomer’s architecture consists of three essential layers that work together to deliver comprehensive AI performance insights:
Infrastructure and Platform Layer
The foundation provides the enterprise-grade scalability and reliability needed to profile workloads across Meta’s massive infrastructure. This includes distributed storage systems using Manifold (Meta’s blob storage platform) for trace data, fault-tolerant processing pipelines that handle huge trace files, and low-latency data collection with automatic profiling triggers across thousands of hosts simultaneously. The platform maintains high availability and scale through redundant processing workers and can handle huge numbers of profiling requests during peak usage periods.
Analytics and Insights Engine
The core intelligence layer delivers deep analytical capabilities through multiple specialized analyzers. This includes: GPU trace analysis via Kineto integration and NVIDIA DCGM, CPU profiling through StrobeLight integration, host-level metrics analysis via dyno telemetry, communication pattern analysis for distributed training, straggler detection across distributed ranks, memory allocation profiling (including GPU memory snooping), request/response profiling for inference workloads, and much more. The engine automatically detects performance anti-patterns and also provides actionable recommendations.
Visualization and User Interface Layer
The presentation layer transforms complex performance data into intuitive, actionable insights. This includes interactive timeline visualizations showing GPU activity across thousands of ranks, multi-iteration analysis for long-running training workloads, drill-down dashboards with percentile analysis across devices, trace data visualization integrated with Perfetto for kernel-level inspection, heat map visualizations for identifying outliers across GPU deployments, and automated insight summaries that highlight critical bottlenecks and optimization opportunities.
How Zoomer Profiling Works: From Trigger to Insights
Understanding how Zoomer conducts a complete performance analysis provides insight into its sophisticated approach to AI workload optimization.
Profiling Trigger Mechanisms
Zoomer operates through both automatic and on-demand profiling strategies tailored to different workload types. For training workloads, which involve multiple iterations and can run for days or weeks, Zoomer automatically triggers profiling around iteration 550-555 to capture stable-state performance while avoiding startup noise. For inference workloads, profiling can be triggered on-demand for immediate debugging or through integration with automated load testing and benchmarking systems for continuous monitoring.
Comprehensive Data Capture
During each profiling session, Zoomer simultaneously collects multiple data streams to build a holistic performance picture:
- GPU Performance Metrics: SM utilization, GPU memory utilization, GPU busy time, memory bandwidth, Tensor Core utilization, power consumption, clock frequencies, and power consumption data via DCGM integration.
- Detailed Execution Traces: Kernel-level GPU operations, memory transfers, CUDA API calls, and communication collectives via PyTorch Profiler and Kineto.
- Host-Level Performance Data: CPU utilization, memory usage, network I/O, storage access patterns, and system-level bottlenecks via dyno telemetry.
- Application-Level Annotations: Training iterations, forward/backward passes, optimizer steps, data loading phases, and custom user annotations.
- Inference-Specific Data: Rate of inference requests, server latency, active requests, GPU memory allocation patterns, request latency breakdowns via Strobelight’s Crochet profiler, serving parameter analysis, and thrift request-level profiling.
- Communication Analysis: NCCL collective operations, inter-node communication patterns, and network utilization for distributed workloads
Distributed Analysis Pipeline
Raw profiling data flows through sophisticated processing systems that deliver multiple types of automated analysis including:
- Straggler Detection: Identifies slow ranks in distributed training through comparative analysis of execution timelines and communication patterns.
- Bottleneck Analysis: Automatically detects CPU-bound, GPU-bound, memory-bound, or communication-bound performance issues.
- Critical Path Analysis: Systematically identifies the longest execution paths to focus optimization efforts on highest-impact opportunities.
- Anti-Pattern Detection: Rule-based systems that identify common efficiency issues and generate specific recommendations.
- Parallelism Analysis: Deep understanding of tensor, pipeline, data, and expert parallelism interactions for large-scale distributed training.
- Memory Analysis: Comprehensive analysis of GPU memory usage patterns, allocation tracking, and leak detection.
- Load Imbalance Analysis: Detects workload distribution issues across distributed ranks and recommendations for optimization.
Multi-Format Output Generation
Results are presented through multiple interfaces tailored to different user needs: interactive timeline visualizations showing activity across all ranks and hosts, comprehensive metrics dashboards with drill-down capabilities and percentile analysis, trace viewers integrated with Perfetto for detailed kernel inspection, automated insights summaries highlighting key bottlenecks and recommendations, and actionable notebooks that users can clone to rerun jobs with suggested optimizations.
Specialized Workload Support
For massive distributed training for specialized workloads, like GenAI, Zoomer contains a purpose-built platform supporting LLM workloads that offers specialized capabilities including GPU efficiency heat maps and N-dimensional parallelism visualization. For inference, specialized analysis covers everything from single GPU models, soon expanding to massive distributed inference across thousands of servers.
A Glimpse Into Advanced Zoomer Capabilities
Zoomer offers an extensive suite of advanced capabilities designed for different AI workload types and scales. While a comprehensive overview of all features would require multiple blog posts, here’s a glimpse at some of the most compelling capabilities that demonstrate Zoomer’s depth:
Training Powerhouse Features:
- Straggler Analysis: Helps identify ranks in distributed training jobs that are significantly slower than others, causing overall job delays due to synchronization bottlenecks. Zoomer provides information that helps diagnose root causes like sharding imbalance or hardware issues.
- Critical Path Analysis: Identification of the longest execution paths in PyTorch applications, enabling accurate performance improvement projections.
- Advanced Trace Manipulation: Sophisticated tools for compression, filtering, combination, and segmentation of massive trace files (2GB+ per rank), enabling analysis of previously impossible-to-process large-scale training jobs
Inference Excellence Features:
- Single-Click QPS Optimization: A workflow that identifies bottlenecks and triggers automated load tests with one click, reducing optimization time while delivering QPS improvements of +2% to +50% across different models, depending on model characteristics.
- Request-Level Deep Dive: Integration with Crochet profiler provides Thrift request-level analysis, enabling identification of queue time bottlenecks and serving inefficiencies that traditional metrics miss.
- Realtime Memory Profiling: GPU memory allocation tracking, providing live insights into memory leaks, allocation patterns, and optimization opportunities.
GenAI Specialized Features:
- LLM Zoomer for Scale: A purpose-built platform supporting 100k+ GPU workloads with N-dimensional parallelism visualization, GPU efficiency heat maps across thousands of devices, and specialized analysis for tensor, pipeline, data, and expert parallelism interactions.
- Post-Training Workflow Support: Enhanced capabilities for GenAI post-training tasks including SFT, DPO, and ARPG workflows with generator and trainer profiling separation.
Universal Intelligence Features:
- Holistic Trace Analysis (HTA): Advanced framework for diagnosing distributed training bottlenecks across communication overhead, workload imbalance, and kernel inefficiencies, with automatic load balancing recommendations.
- Zoomer Actionable Recommendations Engine (Zoomer AR): Automated detection of efficiency anti-patterns with machine learning-driven recommendation systems that generate auto-fix diffs, optimization notebooks, and one-click job re-launches with suggested improvements.
- Multi-Hardware Profiling: Native support across NVIDIA GPUs, AMD MI300X, MTIA, and CPU-only workloads with consistent analysis and optimization recommendations regardless of hardware platform.
Zoomer’s Optimization Impact: From Debugging to Energy Efficiency
Performance debugging with Zoomer creates a cascading effect that transforms low-level optimizations into massive efficiency gains.
The optimization pathway flows from: identifying bottlenecks → improving key metrics → accelerating workflows → reducing resource consumption → saving energy and costs.
Zoomer’s Training Optimization Pipeline
Zoomer’s training analysis identifies bottlenecks in GPU utilization, memory bandwidth, and communication patterns.
Example of Training Efficiency Wins:
- Algorithmic Optimizations: We delivered power savings through systematic efficiency improvements across the training fleet, by fixing reliability issues for low efficiency jobs.
- Training Time Reduction Success: In 2024, we observed a 75% training time reduction for Ads relevance models, leading to 78% reduction in power consumption.
- Memory Optimizations: One-line code changes for performance issues due to inefficient memory copy identified by Zoomer, delivered 20% QPS improvements with minimal engineering effort.
Inference Optimization Pipeline:
Inference debugging focuses on latency reduction, throughput optimization, and serving efficiency. Zoomer identifies opportunities in kernel execution, memory access patterns, and serving parameter tuning to maximize requests per GPU.
Inference Efficiency Wins:
- GPU and CPU Serving parameters Improvements: Automated GPU and CPU bottleneck identification and parameter tuning, leading to 10% to 45% reduction in power consumption.
- QPS Optimization: GPU trace analysis used to boost serving QPS and optimize serving capacity.
Zoomer’s GenAI and Large-Scale Impact
For massive distributed workloads, even small optimizations compound dramatically. 32k GPU benchmark optimizations achieved 30% speedups through broadcast issue resolution, while 64k GPU configurations delivered 25% speedups in just one day of optimization.
The Future of AI Performance Debugging
As AI workloads expand in size and complexity, Zoomer is advancing to meet new challenges focused on several innovation fronts: broadening unified performance insights across heterogeneous hardware (including MTIA and next-gen accelerators), building advanced analyzers for proactive optimization, enabling inference performance tuning through serving param optimization, and democratizing optimization with automated, intuitive tools for all engineers. As Meta’s AI infrastructure continues its rapid growth, Zoomer plays an important role in helping us innovate efficiently and sustainably.
Acknowledgments
I would like to thank my entire team and our partner teams — Ganga Barani Balakrishnan, Qingyun Bian, Harshavardhan Reddy Bommireddy, Haibo Chen, Anubhav Chaturvedi, Wenbo Cui, Jon Dyer, Fatemeh Elyasi, Hrishikesh Gadre, Wenqin Huangfu, Arda Icmez, Amit Katti, Karthik Kambatla, Prakash KL, Raymond Li, Phillip Liu, Ya Liu, Majid Mashhadi, Abhishek Maroo, Paul Meng, Hassan Mousavi, Gil Nahmias, Manali Naik, Jackie Nguyen, Brian Mohammed Catraguna, Shiva Ramaswami, Shyam Sundar Chandrasekaran, Daylon Srinivasan, Sudhansu Singh, Michael Au-Yeung, Mengtian Xu, Zhiqiang Zang, Charles Yoon, John Wu, Uttam Thakore — for their dedication, technical excellence, and collaborative spirit in building Zoomer into the comprehensive AI profiling platform it is today.
I would also like to thank past team members and partners including Valentin Andrei, Brian Mohammed Catraguna, Patrick Lu, Majid Mashhadi, Chen Pekker, Wei Sun, Sreen Tallam, Chenguang Zhu — for laying the foundational vision and early technical contributions that made Zoomer’s evolution possible.


