
Say you receive an email notification that a service is crashing just after your last code change deploys. The crash happens in only 0.1 percent of the servers where it runs. But you’re at a large-scale company, so 0.1 percent equals thousands of servers — and this issue is going to be hard to reproduce. Several hours later, you still can’t reproduce it, and you have spent a full day chasing this issue.
This is where reverse debugging kicks in. Existing methods allow engineers to record a paused (or crashed) program, then rewind and replay to locate the root cause. However, for large-scale companies like Facebook, these solutions impose too much overhead to be practical in production. To address this, we developed a new technique that allows engineers to trace a failing run and inspect its history to find the root cause without the hassle of rerunning the program, which saves an enormous amount of time. We do this by efficiently tracing the CPU activity on our servers and, upon crashes, saving the process history, which is later displayed in a human-readable format with the help of the LLDB debugger, offering everything from instruction history views to reverse debugging.
Sounds great, but how does it work?
To help develop this, we leveraged Intel Processor Trace (Intel PT), which uses specialized hardware to accelerate the collection of the steps in a program, allowing us to use it in production and at scale. However, tracing a program efficiently is just the first step.
Continuous collection and quick storage in production
As we don’t know when a crash will happen nor which process will crash, we need to continuously collect an Intel PT trace of all running processes. In order to bound the memory required to operate, we store the trace in a circular buffer where new data overwrites old data.
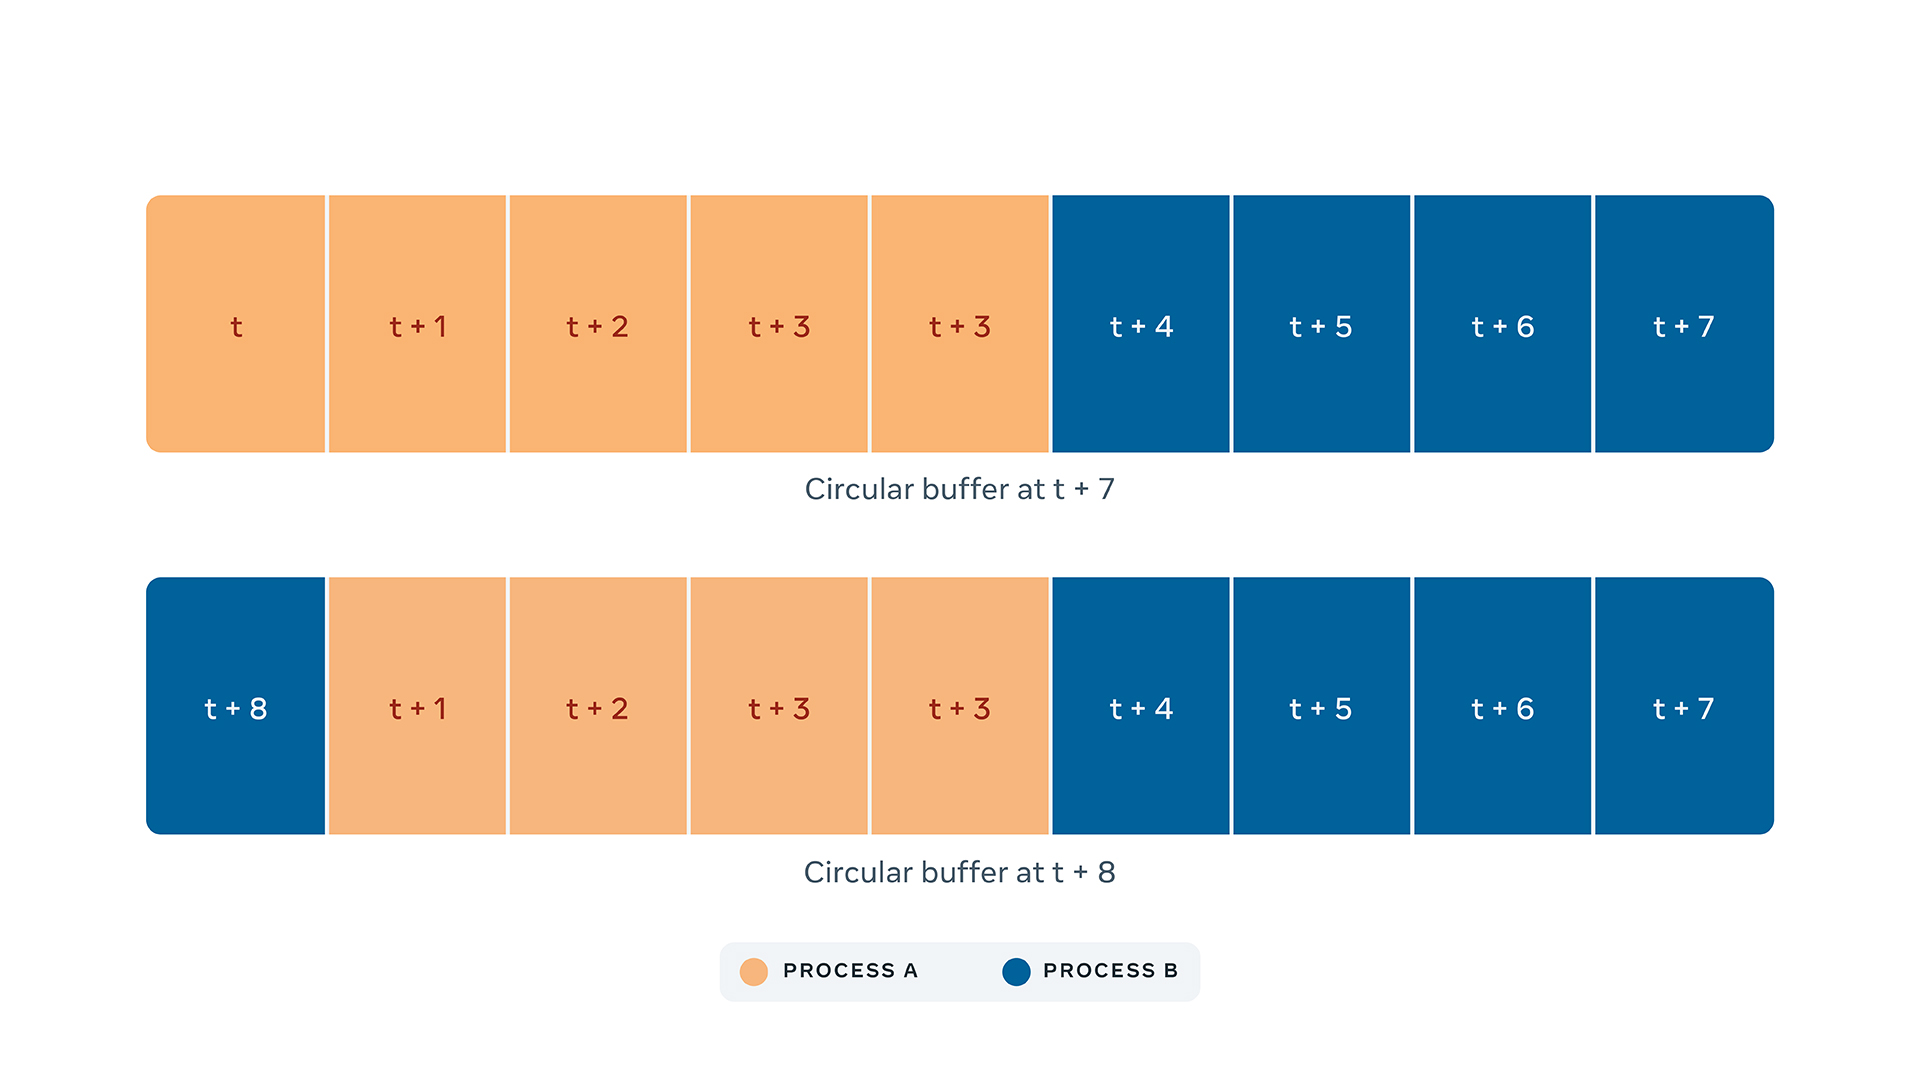
In large servers, like the ones used to train AI models, Intel PT can generate hundreds of megabytes of data per second even in its compressed format. When a process crashes, the collector must pause the collection and copy the content of the buffer for the crashed process. To do this, the operating system needs to notify our collector that a process has crashed, which takes time. The larger the delay between the crash and the copy of the buffer content, the more data that will be overwritten by new data from other processes.
To address this, we designed an eBPF kernel probe, which is a program that is triggered upon certain kernel events, to notify our collector within a few milliseconds that a crash happened, thus maximizing the amount of information in the trace relevant to the crash. We tried several approaches, but none was as fast as this one. An additional design consideration is that crashes often leave the computer in a bad state, which prevents us from doing any analysis on the collected trace on the fly. That’s why we decided to store the traces and the corresponding binaries of the crashed processes on our data centers, so that they can be analyzed later on a different machine.
Decoding and symbolication
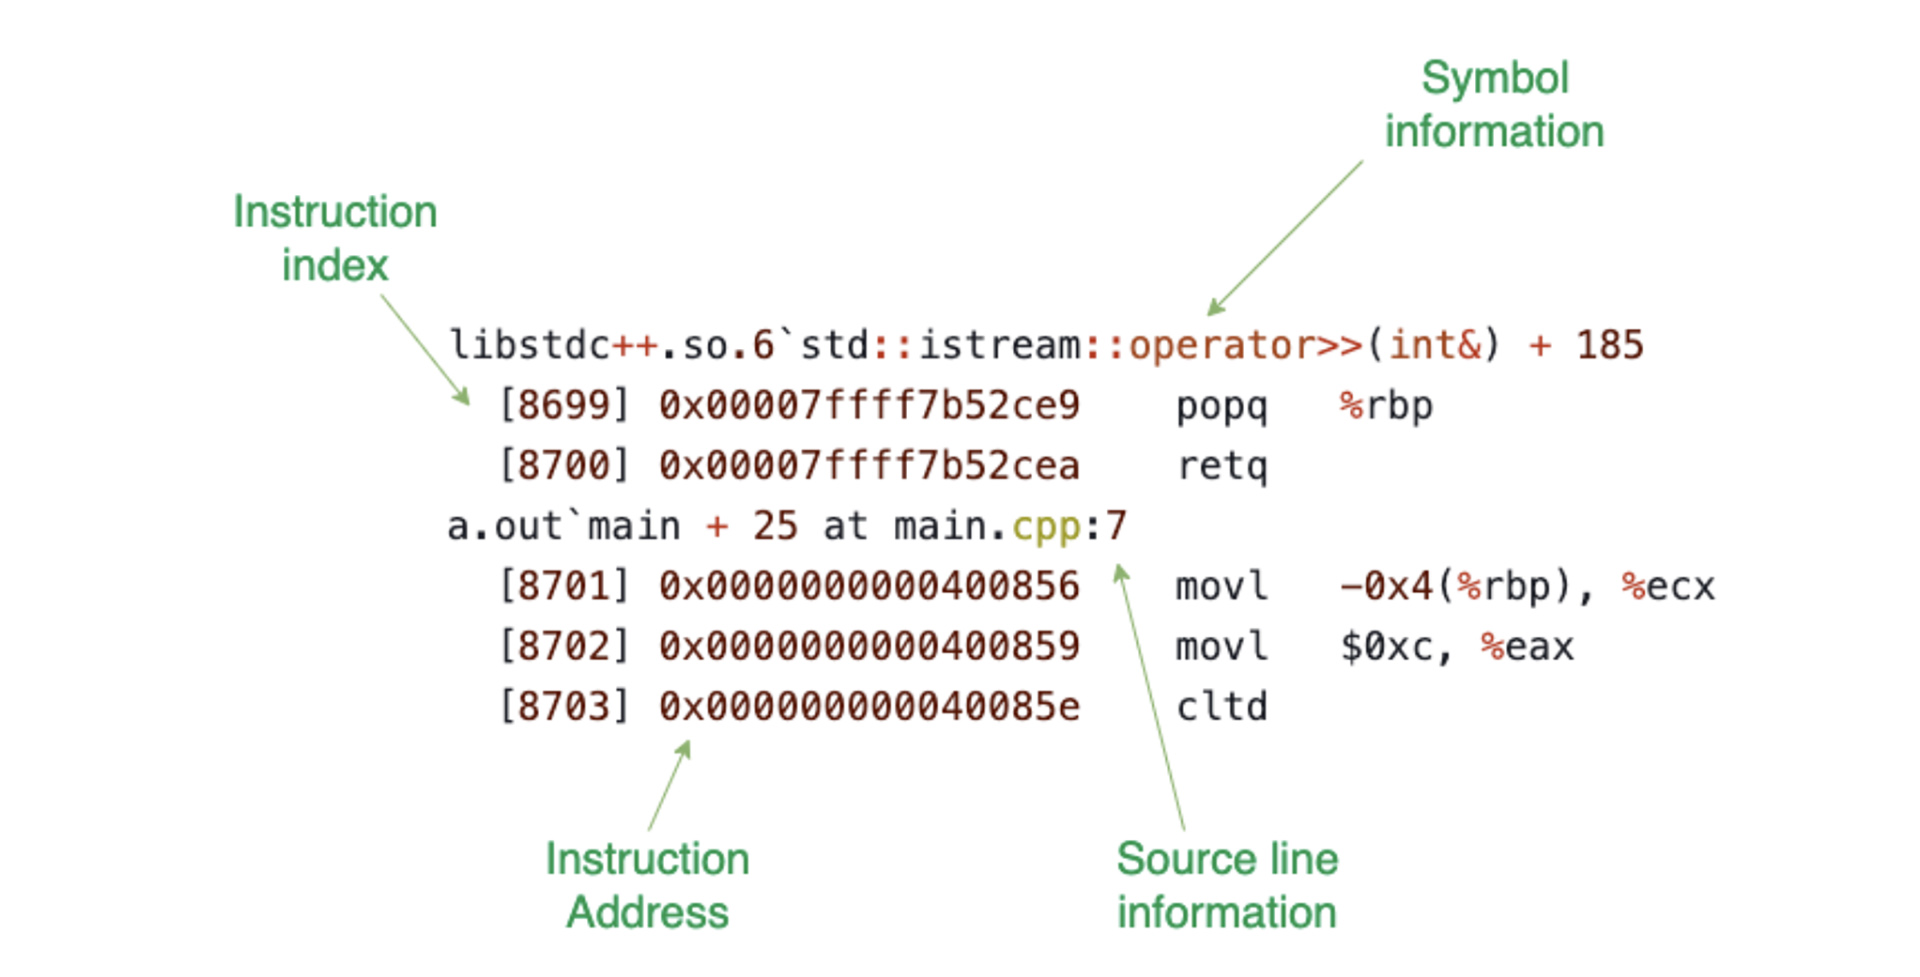
How do we transform this data into instructions that can be analyzed? Raw traces are undecipherable to engineers. Humans need context such as source line information and function names. To add context, we built a component in LLDB that is able to receive a trace and reconstruct the instructions, along with their symbols. We recently started open-sourcing this work. You can find it here.
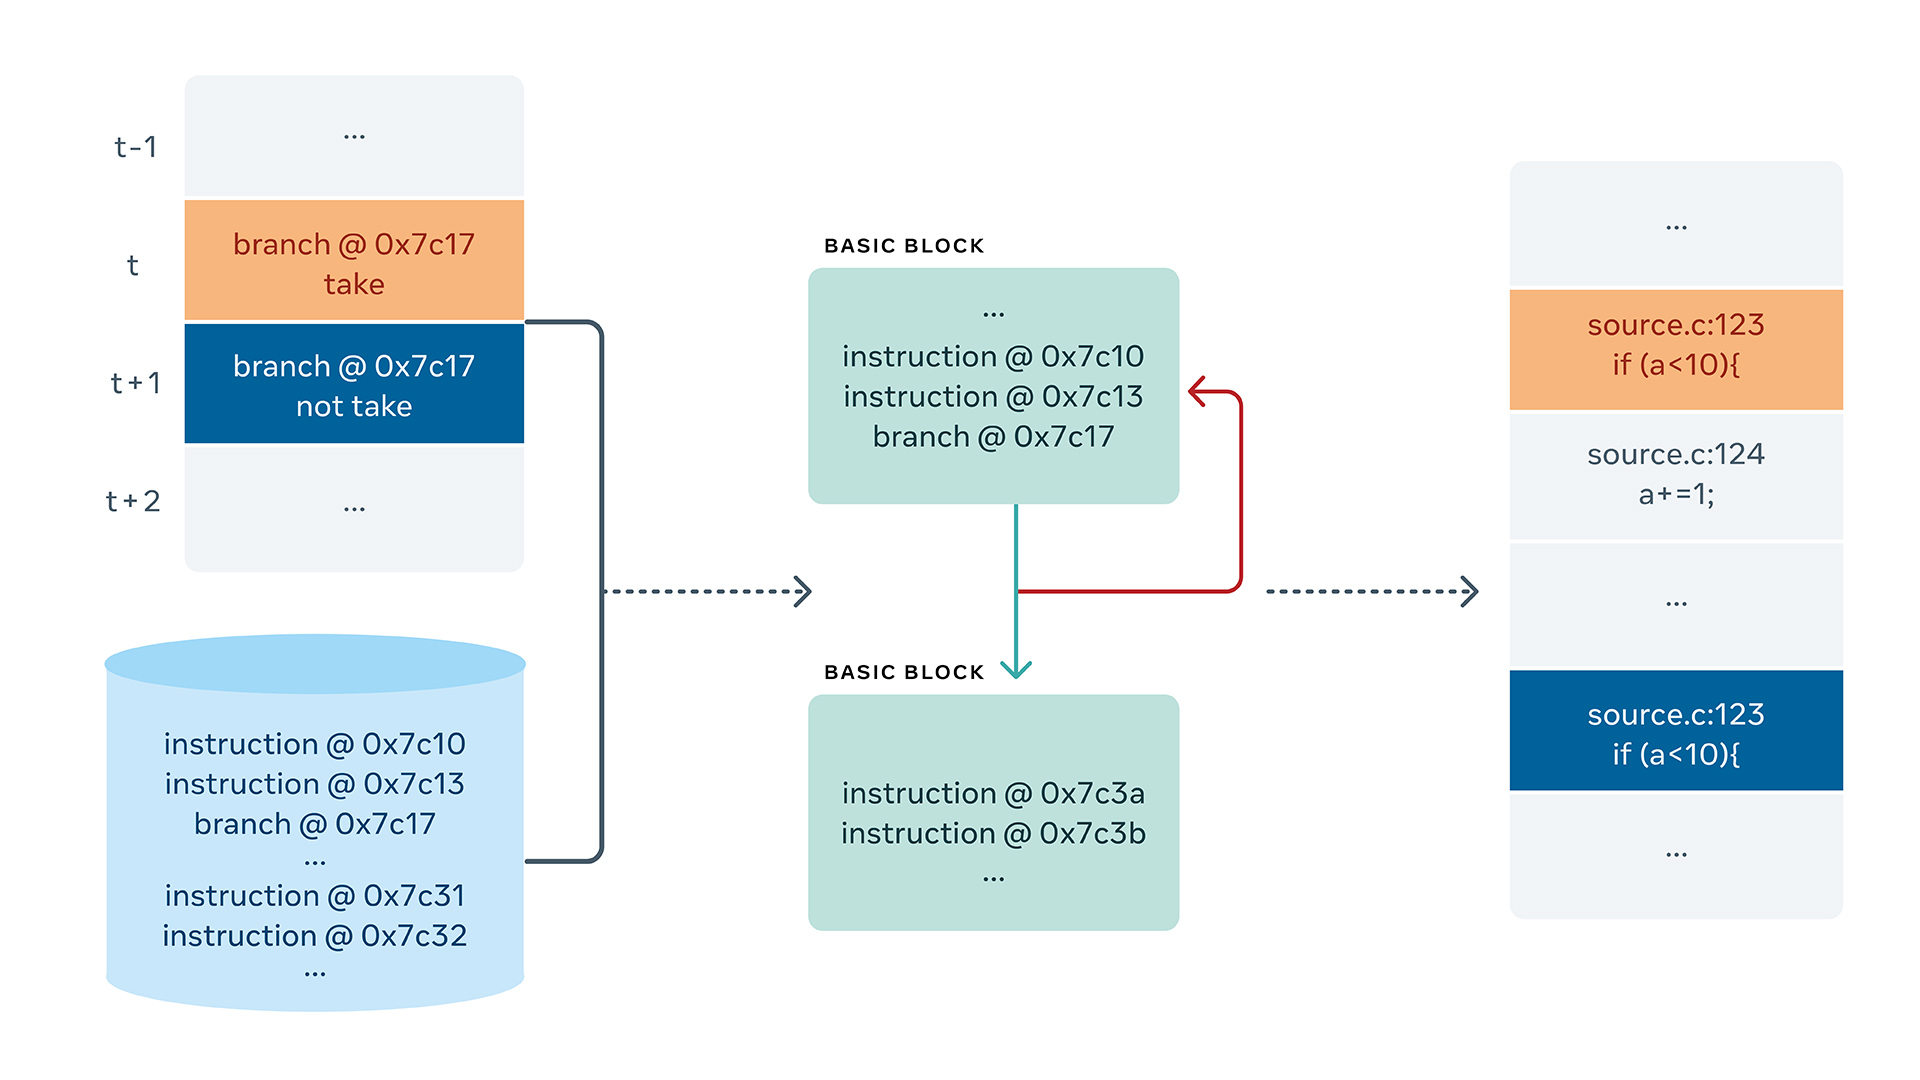
With the flow mentioned in the picture above, we are able to convert raw trace file into the following:
Symbolicating the instructions is only the first part of LLDB’s work. The next part is reconstructing the function call history. For this, we built an algorithm that is able to walk through the instructions and construct a tree of function calls, i.e., which function invoked which other function and when. The most interesting part of it is that traces can start at an arbitrary moment in the program execution, and not necessarily at the beginning.
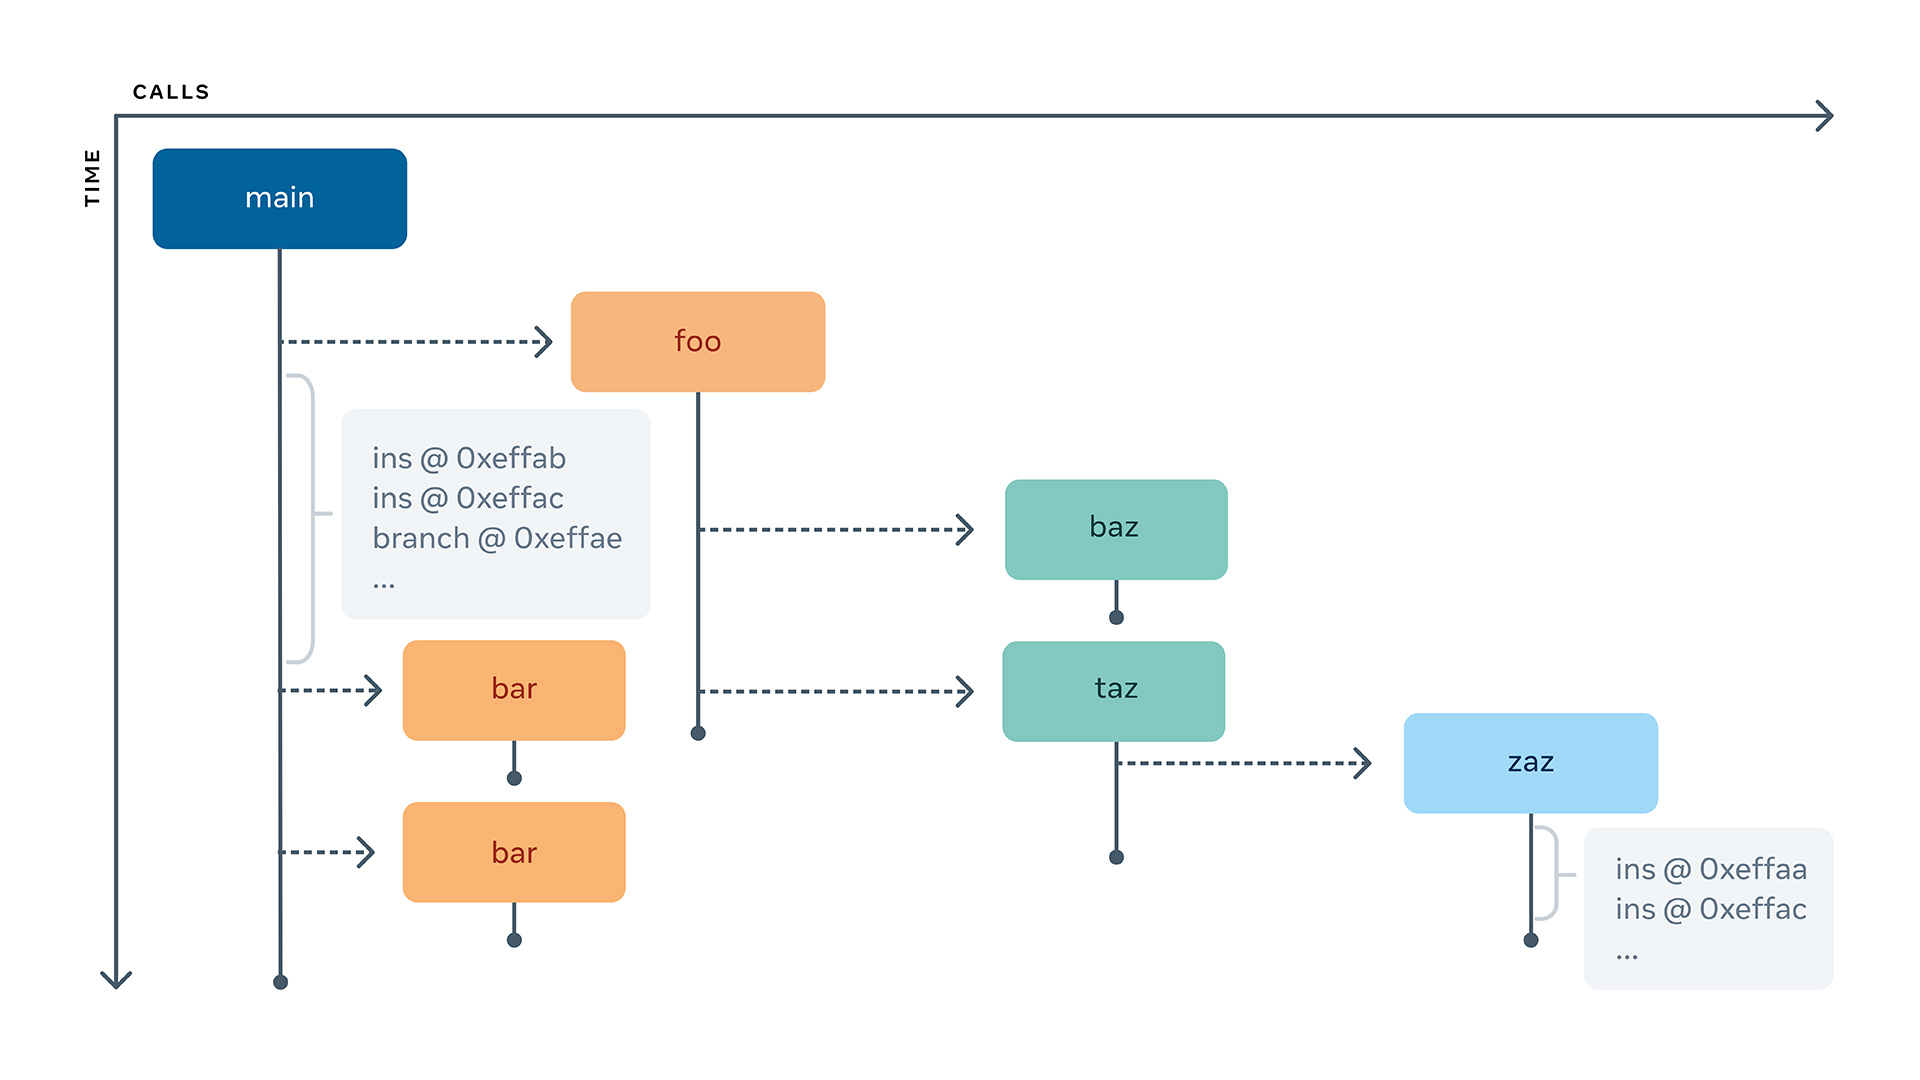
This tree can help us quickly answer questions like what the stack trace is at a given point in history, which is solved simply by walking up the tree. On the other hand, a more complicated question is figuring out where a reverse-step-over stops.
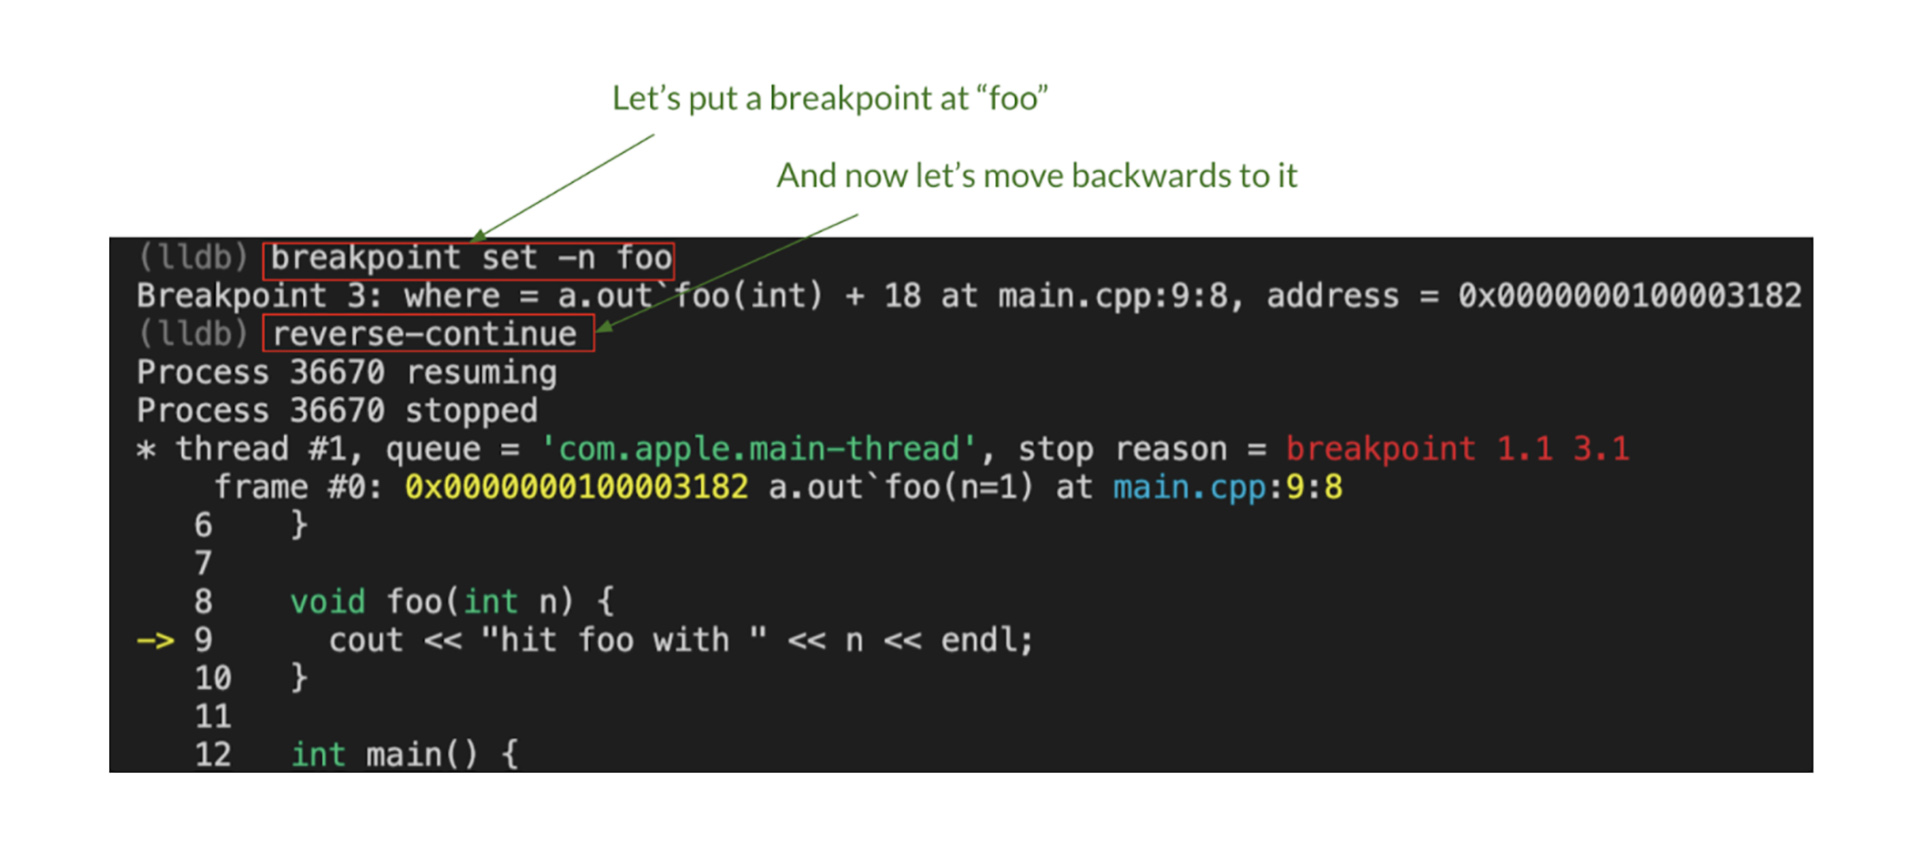
Imagine that you are in line 16 of this little piece of code. If you reverse-step-over, you should stop at either line 13 or 15, depending on whether the if was taken or not. A naive approach would be to inspect the instructions in the history one by one until one of these lines is found, but this can be very inefficient, as the function foo can include millions of instructions. Instead, we can use the aforementioned tree to move across lines without jumping into calls. Unlike the previous approach, traversing the tree is almost trivial.

Besides, breakpoint support has also been added. Suppose you are in the middle of a debug session and you want to go back in time to the most recent call to function_a. Then you could do:
Finally, we are planning to integrate this flow with VSCode at some point, for a rich visual reverse debugging experience.
Latency analysis and profiling
An execution trace contains more information than other representations of control flow, like call-stacks. Furthermore, as part of our traces we are collecting timing information with great accuracy, allowing engineers to know not only the sequence of operations (or functions) executed but also their timestamps, enabling a new use case: latency analysis.
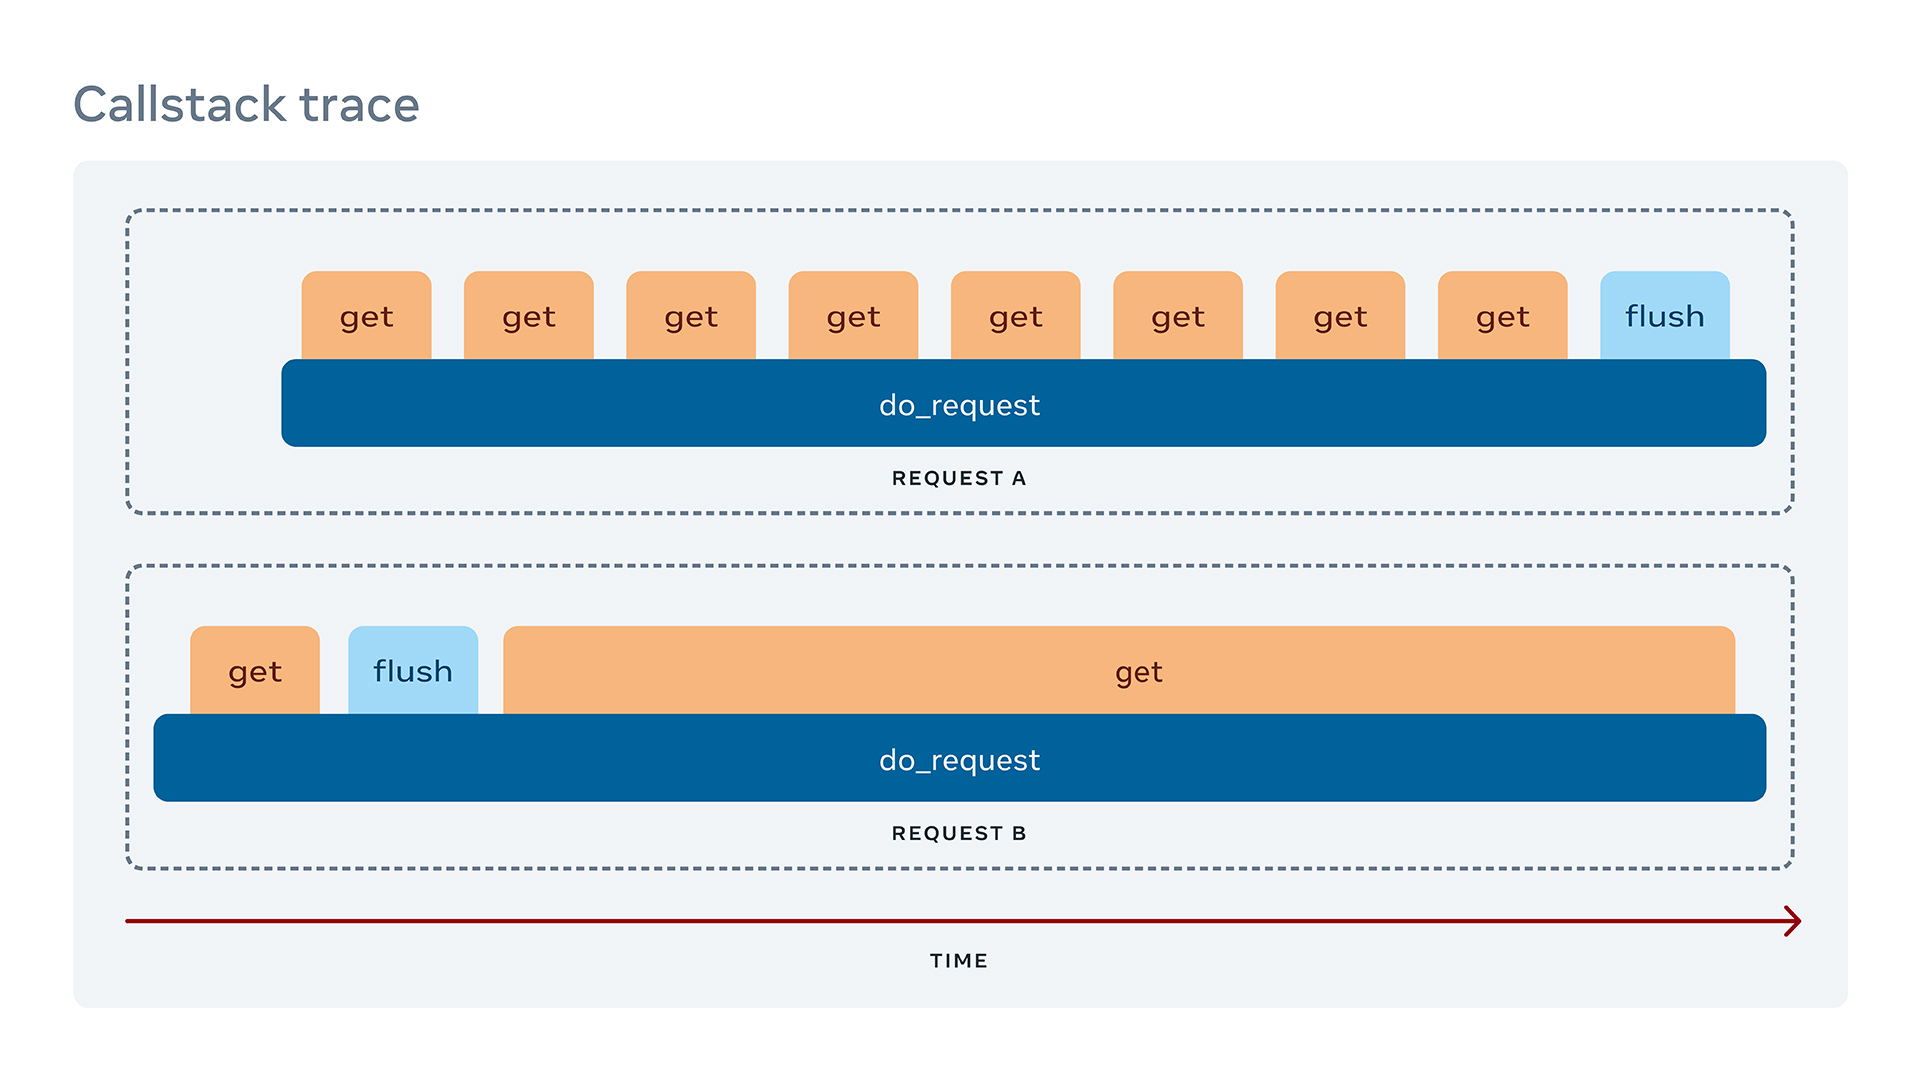
Imagine a service that handles different requests that fetch data leveraging an internal cache. Under certain conditions, the cache must be flushed, and the next fetch call will take much longer.
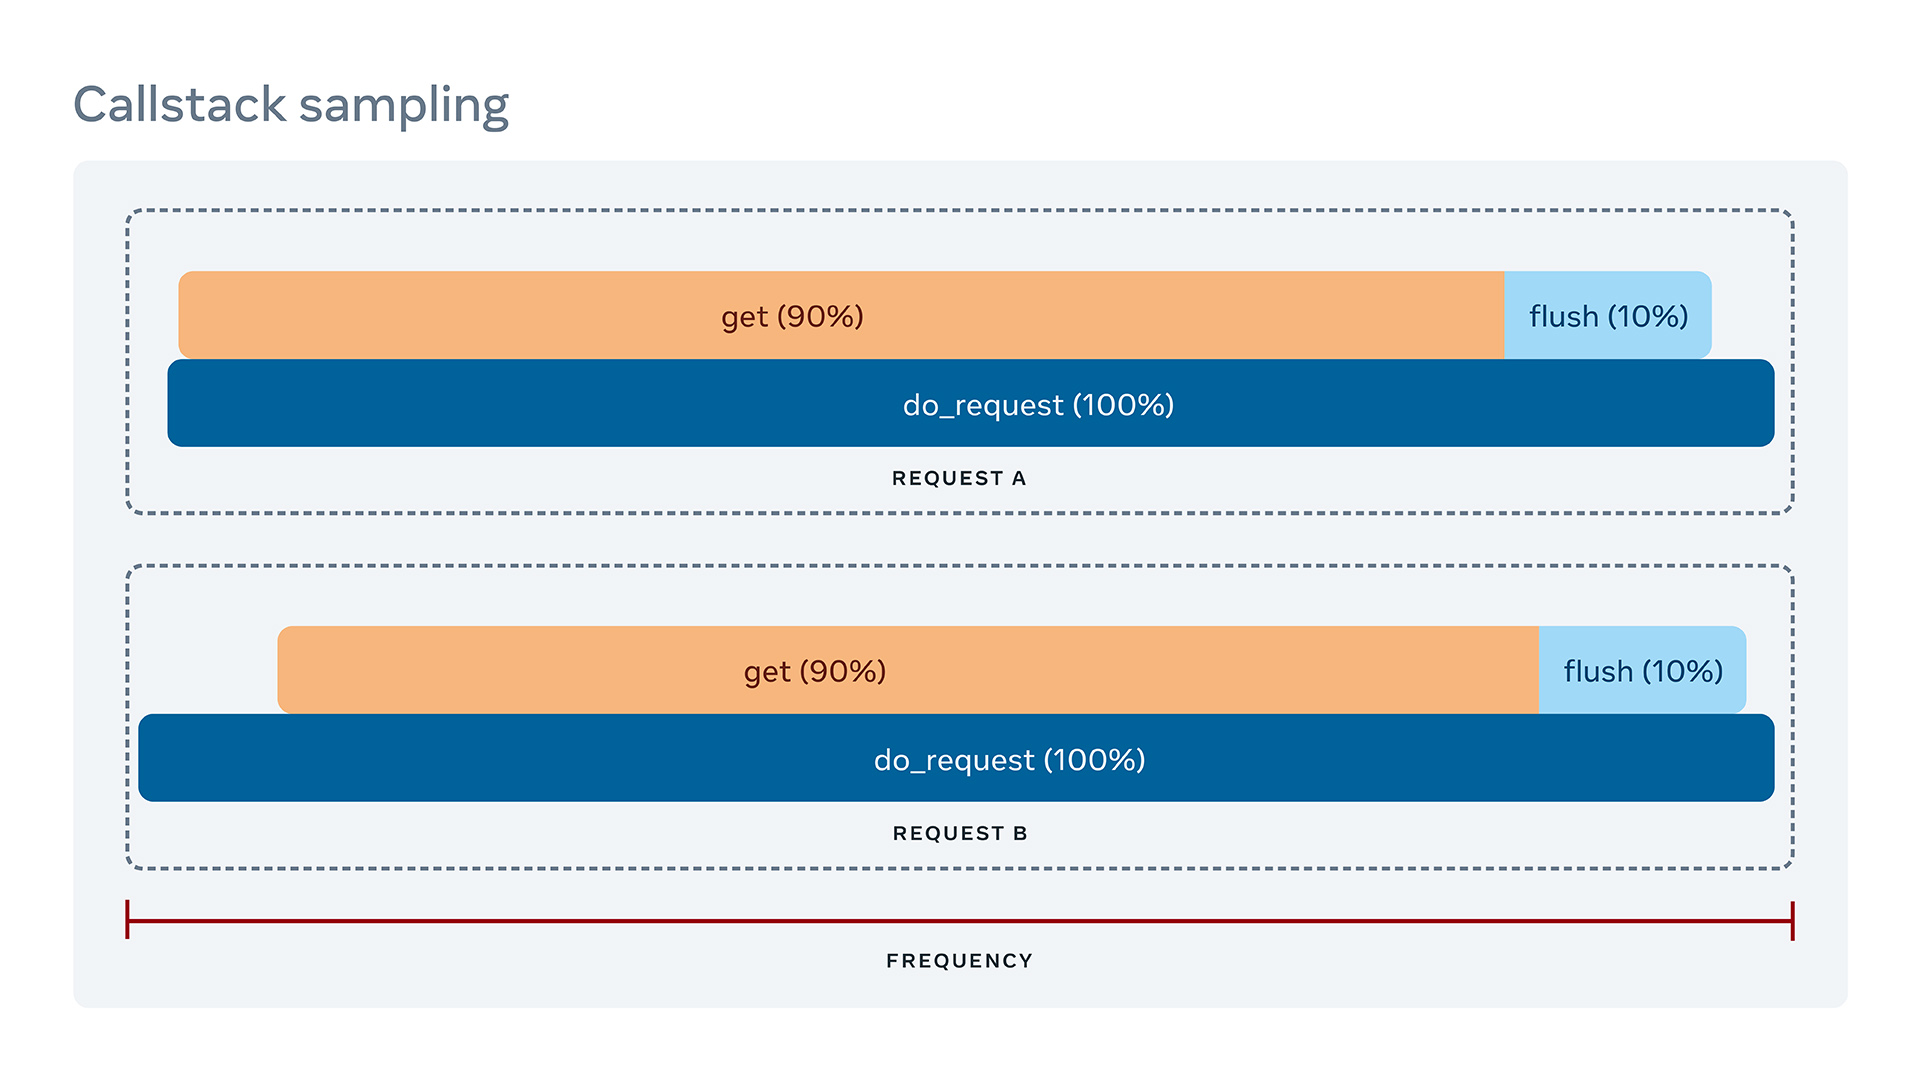
The server receives several requests from engineers, and you want to understand the long tail of the latency in your service (e.g., P99). You get your profiler and collect some sampled call stacks for the main two types of requests. They look like the graph below, which does not tell you how they are different because call stack sampling shows only aggregated numbers. We need to convert traces into execution path info and symbolicate the instructions along the path.
The image below shows a trace, making it easy to understand what’s happening: Request B flushes data before getting it.
While a debugger can help you move within the trace step-wise, a visualization can help you see the big picture easily. That’s why we are also working to add graphs like the “Call stack trace” above in our performance analysis tool, Tracery. We are building a tool that can produce this tracing and timing data, and combine it with the symbolication produced by LLDB. Our goal is to offer developers a way to see all this information at a glance, and then zoom in and out and get the data they need at the level they need.
Remember the undesirable scenario at the beginning of this post? Now imagine that you receive that email notification telling you that your service is crashing in 0.1 percent of machines, but this time it comes with a “Reverse debug on VSCode” button. You click it and then move around the history of the program until you find the function call that shouldn’t have happened or an if-clause that shouldn’t have executed, and get it fixed within a few minutes.
This kind of technology enables us to solve problems at a level we didn’t consider possible before. Most of our historic work in this space resulted in considerable overhead, which limited our ability to scale. We are now building debugging tools that interactive and visually can help developers solve production and development issues in a much more efficient way. This is an exciting endeavor that will help us scale even more.


