
Facebook’s codebase changes frequently each day as engineers develop new features and optimizations for our apps. If not handled properly, each of these changes could potentially regress performance for billions of people around the world. At each step in the development process, we apply a suite of automated regression detection tools to mitigate these risks and to prevent performance regressions from being released. Using so many different tools can mean lots of time spent navigating a jungle of different UIs, configurations, and alerts.
To unify our suite of performance tools and provide engineers with consolidated, actionable information in a more efficient way, we’ve built two new systems: Health Compass and Incident Tracker. Together, these systems have resulted in a significant reduction in distracting alerts. In this post, we’ll share our approach to preventing performance regressions, as well as the unification benefits that Health Compass and Incident Tracker provide.
Catching performance regressions during the development life cycle
The most complete understanding of performance comes from production analytics when code is run at scale in a diversity of environments. While this is our source of truth, any regression that has reached this point will have already affected many people’s experiences. To avoid the impact on people using our services, we need to predict which changes are likely to result in regressions at each stage in the development cycle. The methods we use involve making trade-offs for things like computational resources, accuracy, and ability to debug.
Consider this example code change, which has the potential to introduce a performance regression:
BEFORE
public static Post getBestPost(List<Post> posts) {
  return posts[0];
}
AFTER
public static Post getBestPost(List<Post> posts) {
  return posts.stream()
    .max(Comparator.comparing(PostUtil::getPostRank))
    .get();
}
Systems such as Infer signal any potential issues and predict the effect of those issues as engineers submit changes like this. Such checks are part of our process for all code changes. The examples below illustrate some of the ways we assess performance at each step of the development life cycle and how regressions can be masked until production.
- Development time: Static analysis can highlight that the time complexity has changed from O(1) to O(N) without running the above code changes. For small lists, this may not substantially affect performance in practice, so the notification may not always be useful.
- Continuous integration: We can execute any MobileLab test that covers this code and measure how its performance changes. The code change above may perform differently on devices in the wild or if a different set of input posts are selected for the getBestPost function. We rely on the test author to have selected representative options, as it’s computationally resource intensive to simulate all possible conditions in a lab environment. As a result, some regressions could be missed.
- Beta: We can push the above change to people who have joined our beta program. However, this is not a random sample of people using Facebook, so the resulting analytics could be biased.
- Experimentation: The author of the above change may have also set up additional configuration to enable this new code path only for a small percentage of users, in order to A/B test potential performance changes. In practice, not all code can easily be gated for experimentation, and statistical methods used to determine the magnitude of change have the potential for false positives and negatives.
- Production: After release, we can measure the exact time the getBestPost function takes via instrumentation with tools like Profilo. At this point, if it’s worse, we’ll need to wait until the next release to fix it unless there is a way to mitigate via configuration.
In aggregate across these stages, the associated tools can each catch some regressions while others slip through. Each could also generate distracting false positives that engineers must spend time confirming or disproving. We think of this as a funnel where fewer regressions slip through at each stage, as shown below.

Development life cycle depicted as a funnel, where some regressions are caught at each stage and a smaller number slip through to the subsequent stage.
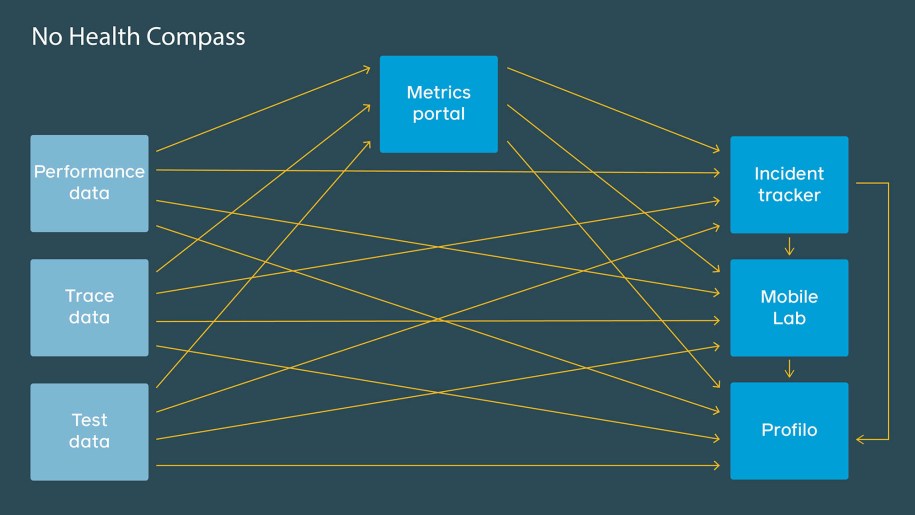
In our original implementation, the tools at each stage worked independently and were built specifically for each stage in isolation. As a result, we needed multiple configurations, which resulted in duplicative or even conflicting configurations, creating confusion for those using the systems. As our ecosystem has grown and we’ve scaled to measure thousands of interactions across these various configurations, the number of alerts and tasks generated has grown exponentially. We needed a fresh approach.
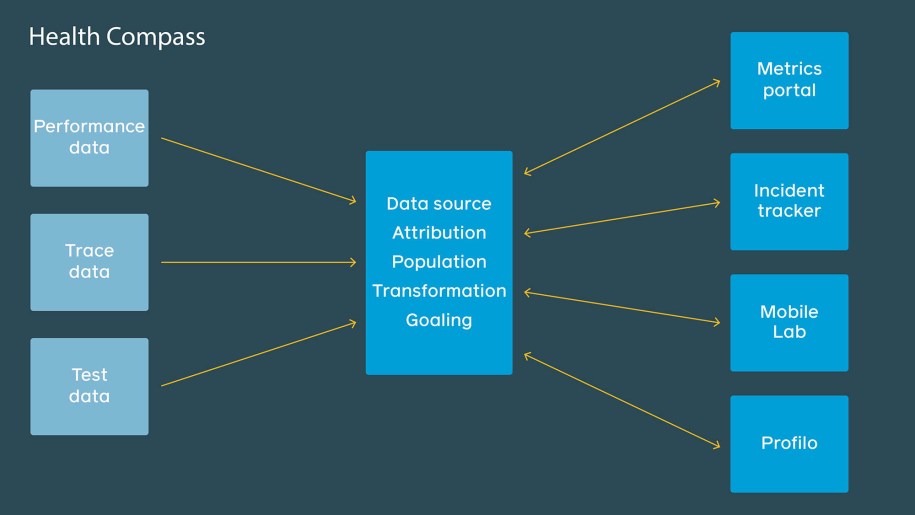
Health Compass: Unified performance scenario configuration
Rather than configure each tool individually, Health Compass gives engineers a single place to describe their performance scenarios, and every tool will display the same metrics, metadata, and pivots. With a single source of truth, small changes (for example, excluding a time range or subpopulation with corrupted data) can be made in one place and apply across all the tools. This way, we greatly reduce the chance of our tools being out of sync and disagreeing on the value of a performance metric.
In Health Compass, engineers describe their performance scenarios via a series of domain-specific Thrift structures in our central configuration management system, similar to the sample shown below.
PerformanceScenario(
    name="Facebook for Android Cold Start",
    app=Applications.FACEBOOK_FOR_ANDROID,
    owner=Employees.JEFFREY_DUNN,
    # Connects scenario definition with in-app analytics logging
    data_source=ApplicationAnalytics(module="INIT", event="COLD_START"),
    unit=Units.MILLISECONDS,
    # We track latency of our scenarios over time and help engineers
    # measure their progress toward concrete speed goals for different
    # classes of devices. This definition allows us to show the same
    # thresholds on all charts and provide a baseline for use in
    # regression detection and alerting.
    goals=[
        Goal(
            population=Populations.PIXEL4_USERS,
            aggregation=Aggregations.AVG,
            value=2000,
        ),
        ...
    ],
    # [Continuous Integration] We can connect MobileLab tests with
    # our scenario to monitor commits and provide root cause
    # analysis via bisecting.
    tests=[
        MobileLabTest("android.fb4a.coldstart.3g_network"),
        ...
    ],
    # [Experimentation] We can enable automatic analysis to flag for
    # any impact on your performance metric from ongoing experiments.
    experiment_dimensions=[...],
    # [Beta][Production] Different types of detectors can be configured
    # for a metric so that related signals from all kinds of data
    # sources can be mapped back to the same scenario
    detectors=[
       DetectionConfig(release_channel="beta", ...),
       DetectionConfig(release_channel="prod", ...),
       ...
    ]
    # [Production] Engineers can configure a number of profiler
    # samples to record further analysis. This setting is pushed to
    # devices in near real-time.
    profiler_sample_rate=...,
)
Sample code for a performance scenario definition for cold start of the Facebook for Android application. Includes cross-tool configuration and metadata.
We’ve worked closely with engineers to develop and improve on UX to enable any engineer to quickly jump into workflows for things like configuration, detection, and analysis. These are some of the UX built for the Health Compass infra for easier onboarding and program creation experiences.
This flexible and singular configuration system ultimately enables entire products and teams to set up standardizations around regression measurement and management practices as changes occur. Scenario definitions also provide a structured, shared language for describing what regressed. This means every tool can annotate detected regressions with common metadata that facilitates reasoning across tools. Incident Tracker uses this information to provide consolidated tasks across our regression systems.
Incident Tracker: Consolidated regression detection
Once code reaches our beta users or production, Incident Tracker’s time series regression detection automatically kicks in for analytics for all performance scenarios defined in Health Compass. Through its structured understanding of scenarios, it can deduplicate issues across different device models and environments. Most important, it provides engineers with a consolidated view of regressions, which summarizes all relevant data for a regression across the development life cycle to aid investigation.
Incident Tracker applies two different types of time series analysis:
- Week-over-week: Compares the latest metrics for a performance scenario with those from the previous week. Many metrics vary based on the day of the week due to user usage patterns, which this method can easily account for.
- Release-over-release: Once mobile apps are released, people will need to download and upgrade to the latest version. Within the first days of a release, the set of people who have chosen to upgrade tends to be a biased sample, skewing toward high-end devices on faster connections. Some performance scenarios also have specific time series patterns at the beginning of a release, due to the nature of the interactions they’re measuring. To account for these biases (as well as the continuous release cycles), our release-over-release method creates a separate time series per released version and aligns them based on time since release. Since this bias is relatively stable, this alignment accounts for the distribution shift and can provide a more accurate comparison for a newly released app.
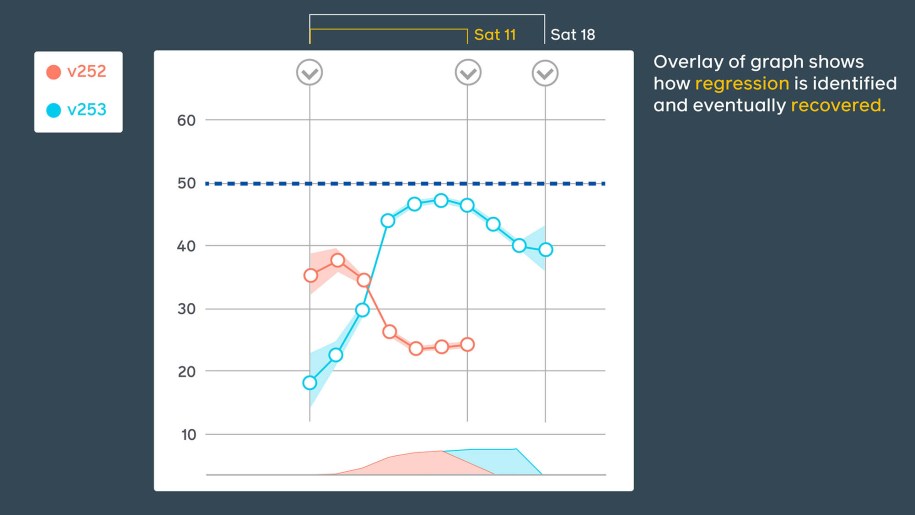
Some of our tools employ specific views overlapping adjacent releases to further emphasize the time and scale of regressions.
For each performance scenario, we typically will monitor many subpopulations based on device type, connection speed, country, and other factors. We also evaluate multiple measures of the distribution (average, percentiles, etc.) to understand how the typical person is affected and to capture any outlier experiences. This creates a large number of combinations and the potential for an overwhelming number of alerts to go to our engineers.
To deal with this, we apply standard statistical methods to generate confidence intervals for the observed changes from both analysis methods. This allows us to reason about the likelihood that any observed change is real as opposed to expected variability. Based on the confidence, our selected tolerance for false positives and/or negatives, and the magnitude of the change, Incident Tracker will choose to discard some regressions to ensure that engineers focus on real, important issues.
To avoid overwhelming engineers, detected regressions across our time series analysis and our suite of regression detection tools are summarized by Incident Tracker into a single task for the life cycle of an issue. We’re able to perform this consolidation through annotations that each tool provides on its regressions, including the performance scenario and app version. This helps build trust that reported issues are meaningful and actionable. All relevant information is provided in one place, so engineers do not need to jump to multiple tools in order to understand what’s going on.
Incident Tracker is able to decipher near real-time data from different tools and update metric owners and teams with any urgent changes (such as confidence levels, post-detection data collection, etc.) related to the monitored regression through tasks and internal notifications. These updates allow engineers to make quick and informed decisions about how to tackle the issue and prioritize it correctly. The detection and subsequent monitoring of real-time data sources are necessary for engineers to react swiftly on the most important performance regressions that are affecting users.
Example task demonstrating a regression detected in beta and then again in production.
When presented with a regression, engineers will often follow a similar pattern — they gather more detailed tracing data to understand what’s happening, look for recent related changes, and create tests which allow them to reproduce the issue. Incident Tracker allows for actions to be automatically taken when regressions occur, so we’re able to begin work like collecting traces the moment we know there’s an issue. This means detailed data can be ready for engineers to analyze when they open these tasks, eliminates any need for manual intervention, and minimizes the wait for data to arrive.
Future work
Through Health Compass and Incident Tracker, we’re able to catch hundreds of performance regressions before releases go out and to efficiently fix issues that otherwise would affect billions of people across our family of apps. There are still many exciting opportunities we’re pursuing to aid engineers in authoring high-performance code.
We’re currently focusing on ways to detect regressions at the earliest stages of the funnel, such as within the IDE. When an engineer is actively coding, attribution of a regression to a specific code change is straightforward and the information is highly actionable, but there are major challenges in generating accurate signals in an efficient and timely manner. We are investigating methods for analyzing the production data available to pinpoint lines of code in the IDE that may have contributed to performance decay and provide inline solutions to drive improvements. We also aspire to apply MobileLab’s testing methodology to automatically schedule tests in the background while engineers work and to bring back results to their IDE within minutes. There are major challenges we’ll need to overcome, including slow build times when optimizations are enabled, gathering detailed coverage data, applying machine learning to select the best tests to run, and redesigning the testing sequence to minimize latency.
We are also developing more intuitive and dedicated UIs for the different types of engineers who interact with the Health Compass and Incident Tracker systems. Navigating the swath of performance jargon, workflows, and tools can be confusing — especially for newcomers, as the learning curve can be high. Providing different generalized views for specific roles in the space (such as a performance analyst versus a product engineer) will help democratize the usage of our tools and make regression management much more scalable as the number of Facebook family apps and interactions continue to grow.


