A big part of working at Facebook is dogfooding our own products. Before new features roll out to the public, our team uses them frequently and thoroughly to figure out what we can do better. So when we started building Open Graph, we were all eager to give Open Graph apps a test run by creating our own and making the internal tools we were already using more social. Here’s a look at some of our favorite in-house Facebook Open Graph apps for work and play, and what we’ve learned along the way that can help you, too.
Phabricator
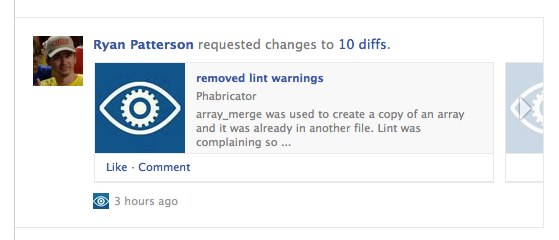
Phabricator is the internal code-review tool every engineer here uses, every day. It was first created in 2008 as a way to review code, track bugs, and browse source code. In its current incarnation, Phabricator is also an open source, php-based web programming stack with a suite of web applications. The stack uses the open source php library libphutil and the open source javelin framework for javascript. Phabricator also includes special privacy rules for revision objects so only employees can see them. When we first started playing around with Open Graph internally, we wanted to test it on something most engineers would use every day to understand what was missing from the product. Phabricator seemed like a good candidate, so at a hackathon I worked with Andrei Bajenov and Philip Zigoris to build an Open Graph integration for the tool in one night. Since then, the integration has evolved into much more than a test. We now depend on it to do our day-to-day jobs, and it’s also just a cool way to show the people you’re working with what’s interesting about your code. Whenever someone does any action in Phabricator like creating, accepting, closing, or requesting changes, we publish a single Open Graph action against a “diff” object. The diff contains the list of reviewers, people cc’d, author, and line count in addition to the default properties. By applying each action against this single object, we get single ticker stories of “Paul committed Convert loaders to Late Static Binding” that people can like and comment on. Many actions of the same type aggregate together:
The really interesting things are when different actions roll up into aggregations. We can show how many lines of code you committed, or who your favorite reviewers are, or what your longest diff is:
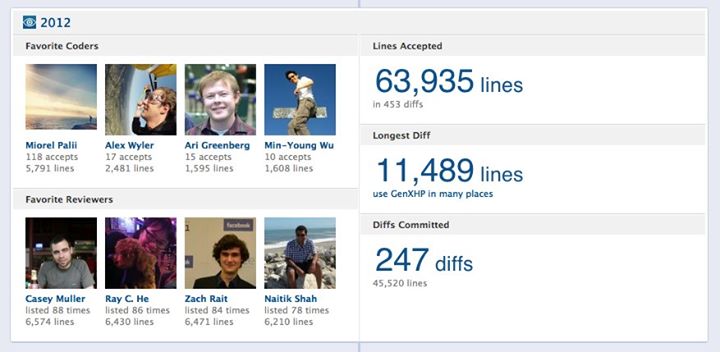
The phabricator aggregations are now a badge of honor you can wear on your timeline. We decided to highlight the people you code with and the number of lines accepted over your own output to encourage collaboration.
Pixelcloud
Pixelcloud is another internal tool we created to easily upload and share mockups, screenshots, and other files at Facebook. The interface is really simple, and it lets us share graphics without any image compression, which is useful for designers.
The Open Graph integration Jack Lindamood and Lee Byron built has been valuable because its distribution exposes more employees to the awesome content, like early product mocks. You can tag your content, add a caption for context, and get input on your image through comments on the News Feed story your upload creates. Pixelcloud also shows the profile pictures of everyone who has clicked the link, so the content owner has an idea of who has looked at the content.

Scuba
Scuba is a distributed in-memory data store system we developed for doing real-time, ad-hoc analysis of arbitrary datasets. Queries take less than a second to fulfill, even when traversing hundreds of millions of samples and hundreds of gigabytes of data. Scuba creates awesome data visualizations, and anyone in the company can pull up this data and analyze the graphs, no matter what background they have. Okay Zed made Scuba more social during a hackathon because we think that social aggregation can bubble up more interesting graphs and pieces of data that are being looked at in concurrence. Having people publish data through the Open Graph can lead to analysis opportunities where data can be examined around similar events. For example, the question “What graphs did everyone look at while event X was going on?” could help expose correlated events.
SIOG
SIOG publishes actions that Facebook employees take related to Sigma, a machine learning infrastructure for classification and ranking that our Site Integrity team uses to fight spam on the site. For example, creating or updating a Sigma rule results in an Open Graph story. Abe Parvand integrated Sigma with Open Graph, which became a perfect tool to create custom actions and objects since Sigma has rules, features, and responses that anyone can create, update, or delete. SIOG has been cool to work with because it shows people the additional ways Sigma is being used to fight spam on the site, in real time, via the site itself.
StayFitFB
When we moved to our new campus in Menlo Park, one of the most highly anticipated additions was the new fitness center. But before most people had a chance to check it out, they saw stories in their News Feed about friends who had just completed a workout there with the StayFit app. StayFit allows employees to track their workouts and stay motivated by creating Open Graph actions each time they badge in to the MPK fitness center. This activity lends itself perfectly to Open Graph because instead of checking in or posting a status update at each workout, badging in lets employees explicitly declare that they are working out, and custom Open Graph enables cool timeline aggregations to help you reflect on activity over time.
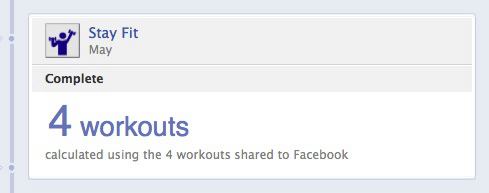
Since Dave Schatz first built the app, 322 Employees installed the it and 249 people are monthly active users. In the last 30 days, 1,751 actions were published, which resulted in 369,380 story impressions across news feed, ticker, and timeline. Next, we’re looking at integrating StayFit more deeply into the treadmills and elliptical machines in our gym, and we’re already talking with those manufacturers to get started.
Pokemon
The Pokemon app is like an Easter egg for employees – every time someone closes something out in Tasks (one of our internal workflow tools), they “catch” a Pokemon that then lives in an aggregation on their timeline. Pokemon was first seeded when employees created a Group for Pokemon lovers at Facebook. An engineer wrote some code that made it so every time you closed out a task, you’d see a Pokemon fly across your screen. There wasn’t any recording of the Pokemon people “caught,” but people really wanted to see their history. As a workaround, one engineer started posting to his timeline every time he caught a Pokemon so he could track them. At a recent hackathon, Lu Chen and Steven Elia thought that since we now had Open Graph apps, it would be a great opportunity to evolve the app so that every time you close a task, it creates a story in News Feed that lets you see what Pokemon you caught and all the tasks you closed. We also made an internal Page that looks a little like the Pokedex as another way to aggregate these stories.
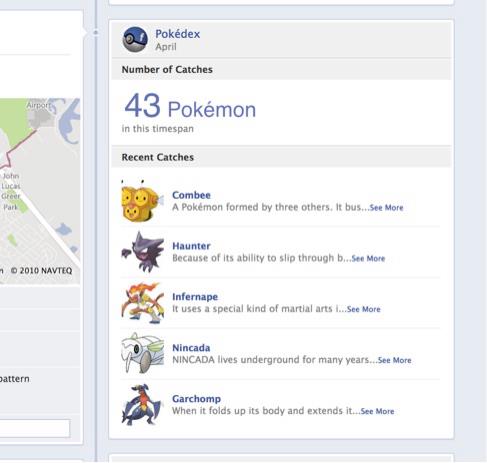
Here’s a quick overview of how building an Open Graph app like Pokemon works: First, we assume that all the objects in your system live on the Web and have some canonical URL. We then provide a developer tool that basically lets you design and define your graph—the types of objects in your system, and then the types of actions. After you’ve designed the schema, then we ask you to add instance metadata to your web pages. So in this case, I’m defining what it means to be a Pokemon (see below). Every object starts off with some basic metadata, like a name, a URL, an image, and a description, as well as a bunch of optional properties. To help you understand the model, we preview what this type of object will look like on Facebook.
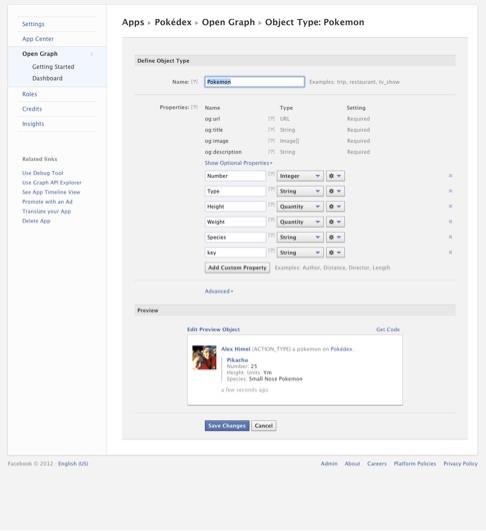
One of the cool things about building on our own platform is that we’ve been able to catch bugs and figure out pain points for developers. We learned that it’s really important to think hard about how you want to model your objects and actions at the beginning. When we started the Pokemon app, we wanted to display Tasks by their number, but later we realized it would be much more useful to include more information about them and make them an object. It was much more difficult to handle later in the process, and we’re now looking at ways to make that easier for all developers.
Hopefully these examples have inspired you to use the Open Graph to track whatever is important in your day-to-day life. It is as simple as describing your data model in the Open Graph Tool, putting a link on your site for users to authorize your Facebook App, and then calling the API whenever someone does an action. As soon as you accomplish that, I’d love to hear about the interesting uses of the Open Graph you build.


