Several years ago, Facebook was largely rendered server-side, and there was only a small amount of JavaScript on the site. To understand loading time, we could apply simple tools that focused solely on server performance. Today, we face very different challenges. Facebook has become increasingly interactive, which has motivated the transition to powerful client-side rendering frameworks like React. Time spent in browser rendering and scripting has grown to become a major bottleneck in loading facebook.com — at the beginning of 2016, we found that the majority of load time was spent on the client. To solve this problem, we set out to build a system capable of detecting changes in performance that can run on any commit to automatically prevent client regressions from shipping to production.
Today that system is known as BrowserLab, and it automatically analyzes the performance of every code change made by engineers at Facebook. Tiny regressions can add up quickly when working at Facebook’s scale, where there are thousands of commits each day. BrowserLab catches even the smallest regressions that engineers write — as small as 20 ms — and ensures that the site continues to load quickly. Ever since we introduced the system, it has caught regressions each week and helped engineers identify optimizations to remove over 350 ms from every page load.
Below we’ll share the systems and methods we applied to build BrowserLab, which we hope will help others build systems to optimize other sites on the web.
Building BrowserLab
In our first attempt at building this system, we deployed internal copies of Facebook with and without the specified commit, then used WebDriver to start a series of Chrome instances to load News Feed and collect timing metrics. Unfortunately, such a simple system suffered from extremely high variance in the collected metrics. Average measurements were accurate only to 500 ms, meaning we could detect only the largest, most obvious regressions and optimizations. It was clear that we needed to take a more sophisticated approach and dig deeper to understand sources of noise and control them.
We began to search for possible sources of noise in our experimental setup. We applied every tool at our disposal to compare runs — we gathered detailed traces using Chrome’s tracing APIs, took automated screenshots, generated diffs of DOM contents, and added server-side instrumentation to compare entry points into JavaScript code. Our analysis identified several sources of noise:
- Environment: Both the client and web server are expected to add some amount of variance due to unpredictability of hardware and software. Examples include seek time for disk reads and writes, background processes causing CPU contention, and network congestion. We aimed to control for as many sources of environment noise as possible.
- Data: Content on Facebook is highly dynamic. If you constantly refresh facebook.com, you’ll see changes in News Feed stories, new sidebar content, and Like counts increasing. We need to ensure that data does not change between iterations of our experiment and that data is consistent between control and treatment web servers.
- Code non-determinism: A given page load on Facebook is not completely deterministic. There are elements of ranking that incorporate randomness as well as sampling applied for time consuming logging operations. This randomness can take place on both the server and the client, and needs to be controlled to produce consistent, accurate results.
if (mt_rand() < 0.1) {
    do_slow_client_logging();
}
Example of server-side randomness that can cause inconsistency across trials.
System design
In our next iteration of BrowserLab, we set out to control for each of these types of noise. We introduced a series of new components throughout our system to improve our accuracy in detecting changes in page load time.

HTTP Proxy: Isolating server noise from client performance
In our initial implementation, where we repeatedly loaded facebook.com from the control and treatment web servers, every iteration effectively tested the performance of both the server and the client. We already have tools for measuring server performance, so with BrowserLab we focus on measuring client performance. To measure tiny differences in client performance, we need to isolate the client code.
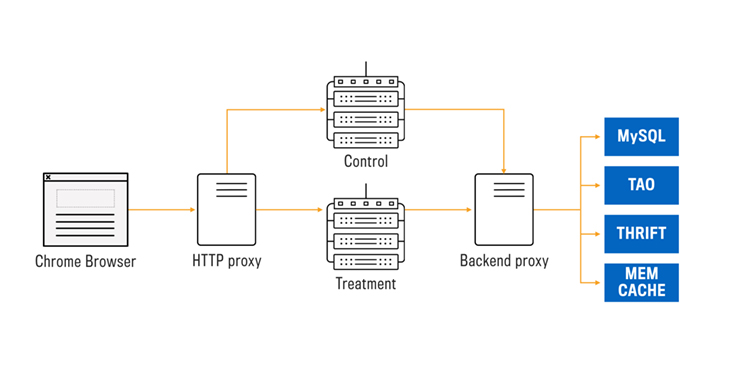
We do this by sending requests through an HTTP proxy server. The proxy caches request and response pairs, instantly responding if there’s a hit. After a warm-up phase where we populate the proxy cache, the proxy will contain all resources needed to serve the page.
We run the proxy and Chrome instances on the same machine and alternate test iterations between control and treatment. This removes both server and network noise, isolating the entire performance test to a single machine. It also removes noise caused by a hardware or software difference between two client machines. We reserve multiple cores for use by the proxy and Chrome on our client machines to ensure there is no significant CPU contention.
Reducing client environment noise
Once we eliminated server/network noise, we focused on reducing client environment noise. Our analysis of tracing data revealed two major sources:
- Disk writes: Many outlier trials contained writes like flushing cache and history to disk. We observed much greater variance in disk write performance compared with CPU. Since loading facebook.com is primarily CPU-bound, we relocated the browser directories to a RAM disk to eliminate reliance on physical disks. This eliminated a major source of outliers.
- Browser state: The performance of a long-running browser instance changes over time due to factors like caching and other internal states. To ensure we are consistently measuring the same setup, we launch a new instance of the browser and tear it down in each trial. We ensure that the browser cache, configuration, and cookies are exactly the same for every trial.
Backend proxy: Consistent view of Facebook data
After we record the initial request/response pairs in the HTTP proxy, all client performance measurements will be isolated from the server. However, in this record phase, the control and treatment servers may not fetch the exact same data and can produce dramatically different responses. Products like News Feed are highly dynamic, so new stories and ranking changes can occur even between refreshes of the same page. We need to ensure that both the control and treatment servers receive the same News Feed, notifications, and sidebar content to provide a valid comparison. If the control News Feed contains an auto-play video while the treatment News Feed only contains static content, we will detect performance changes that are not caused by the tested code change but instead by a change in the page content.
To address this issue, we place another proxy layer between the web servers and all backend services and storage layers. The backend proxy understands the protocols we use for data fetching and caches request/response pairs for the web servers. Both the control and treatment servers now will have the same view of Facebook’s data and produce identical page content.
Code non-determinism
Code non-determinism can occur on both the client and the server. On the client, we want to test the same JavaScript code paths in every trial of an experiment. To eliminate randomness, we replace Math.random and Date with custom, seeded versions. Since JavaScript is single-threaded and execution order is deterministic, this is sufficient to control randomness on the page.
On the server, we must ensure that the control and treatment servers send down the same components and request the same JavaScript code to be executed — we do not want some elements to be randomly included or excluded. We take a similar approach as we do on the client where we replace HHVM’s random functions with deterministic versions. However, due to the use of async fetching, execution order is non-deterministic, so seeding the random number generator is not sufficient. Instead, our custom random implementation generates a backtrace and uses it to produce a unique series of random numbers per call site to PHP’s random functions. This seeding approach is stable across execution ordering and across machines, eliminating our non-determinism problem.
Experiment procedure
We combine all the elements above into an experiment procedure:
- Deploy servers: Use a shared pool of machines to start control and treatment web servers with respective versions of Facebook to test. Set up a server to run the client and proxy servers.
- Benchmarking: Measure performance for a series of test users with data representative of the distribution of real users.
- Record phase: Populate the HTTP proxy with request/response pairs.
- Replay phase: Alternate between requesting the control and treatment webpages for 50 trials. Measure and record performance numbers. Note that the web server is no longer needed since full responses are available in the HTTP proxy.
- Aggregation: Compute statistics across trials and across test users to determine the average change in performance numbers.
Results & root cause analysis
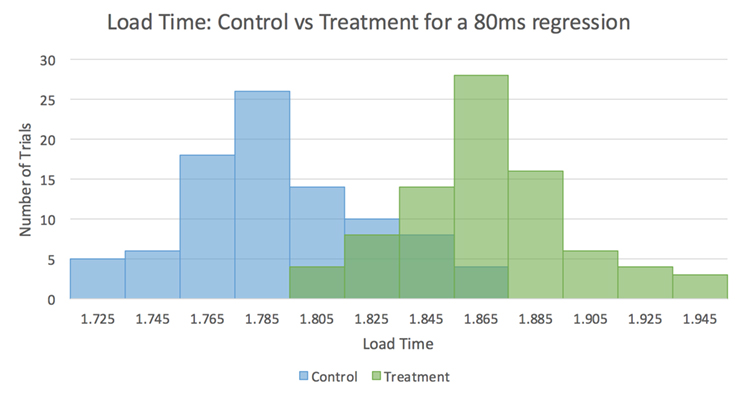
With this setup, we’re able to accurately measure changes as small as 20 ms in page load time with 95 percent confidence across a set of 50 representative test users. This accuracy has been invaluable in identifying numerous page load optimizations and preventing regressions from being pushed to production.

We also compute aggregations of Chrome’s tracing data to show engineers the root cause for changes in page load time. We aggregate the exclusive time from each trace event into several categories, and then aggregate these across control/treatment trials. We compute the average difference between control and treatment, and then aggregate these differences across test user accounts. This analysis allows us to produce a table similar to the one shown below to illustrate which browser activities have consumed more time or less from the tested code change.

Automated regression detection
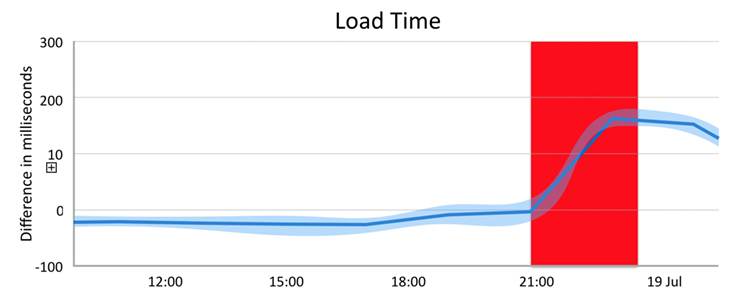
Once we completed this measurement platform, we wanted to ensure that no regressions are pushed to production going forward. We automatically run BrowserLab on a continuous basis, kicking off a run comparing the current production branch to trunk every two hours. We apply change point analysis to detect step changes in timing metrics and perform an automated bisect to find the code change that caused the regression. The bisect process integrates with our task tracking system by automatically alerting the engineer who authored the commit of the detected issue and blocking future pushes until the regression is resolved.

Future work
BrowserLab has been invaluable for preventing regressions in page load time and helping engineers identify possible optimizations. There are still many exciting future directions that we’re pursuing to continue to make the platform even more useful for engineers.
Over the past few years, we’ve seen a growing shift from web to mobile. While we’ve already built platforms like CT-Scan to identify and prevent regressions in our native mobile apps, we do not have a similar platform for our mobile website. BrowserLab can load our mobile website today, but performance of Chrome running on server-class hardware is not likely to be representative of real mobile devices. Using Facebook’s mobile device lab, we plan to run instances of Chrome for mobile on actual phones and gather representative performance data.
We also plan to expand to cover interaction testing. Our existing system focuses on initial page load time, but people on Facebook also care how quickly the page responds when commenting on and liking stories, starting live videos, and much more. Facebook already has a large range of existing WebDriver-based tests used to catch bugs in our codebase, which we plan to integrate into the BrowserLab environment to cover many other scenarios.


