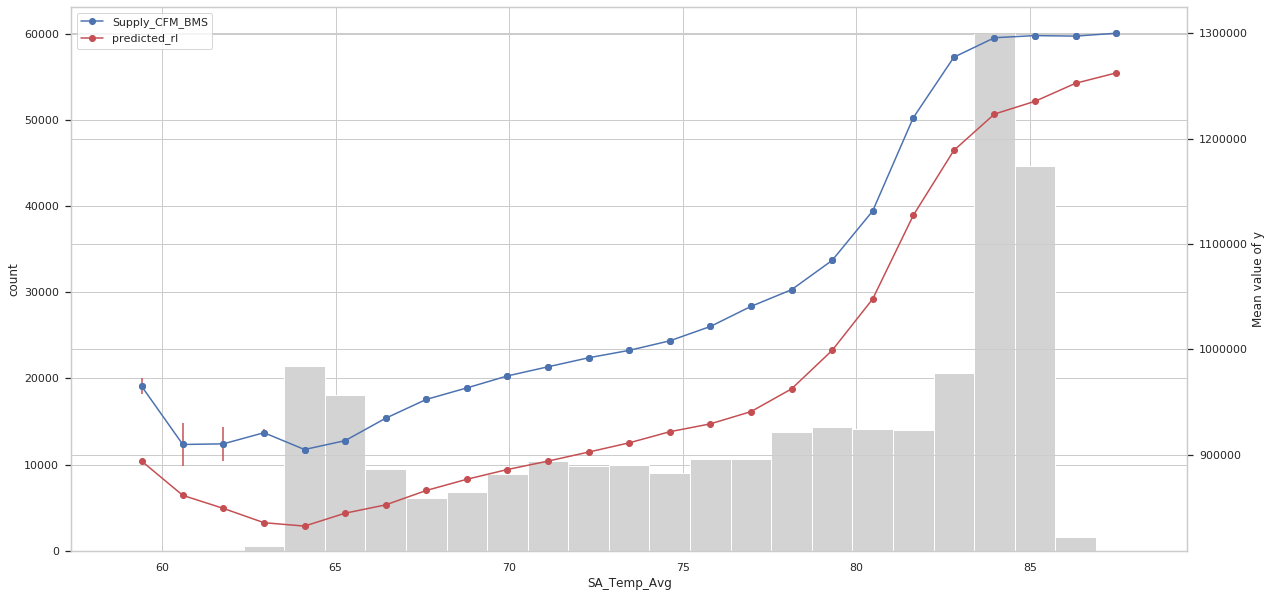
Figure 5. A breakdown of airflow savings at different supply air temperatures.
Meta believes in building community through open source technology. Explore our latest projects in Artificial Intelligence, Data Infrastructure, Development Tools, Front End, Languages, Platforms, Security, Virtual Reality, and more.


To help personalize content, tailor and measure ads and provide a safer experience, we use cookies. By clicking or navigating the site, you agree to allow our collection of information on and off Facebook through cookies. Learn more, including about available controls: Cookie Policy