Developing apps and services that scale to millions or billions of people can present uniquely complex performance challenges. Optimizing infrastructure, scaling web services, and developing fast mobile apps are all part of the job to keep large-scale systems performant. At this year’s event, attendees gathered to hear speakers from Facebook, Google, NVIDIA, and other companies discuss innovative solutions for large-scale systems.
If you missed the event, you can view recordings of the presentations below. If you are interested in future events, visit the @Scale website or follow the @Scale Facebook page.
Keynote: The Facebook app journey
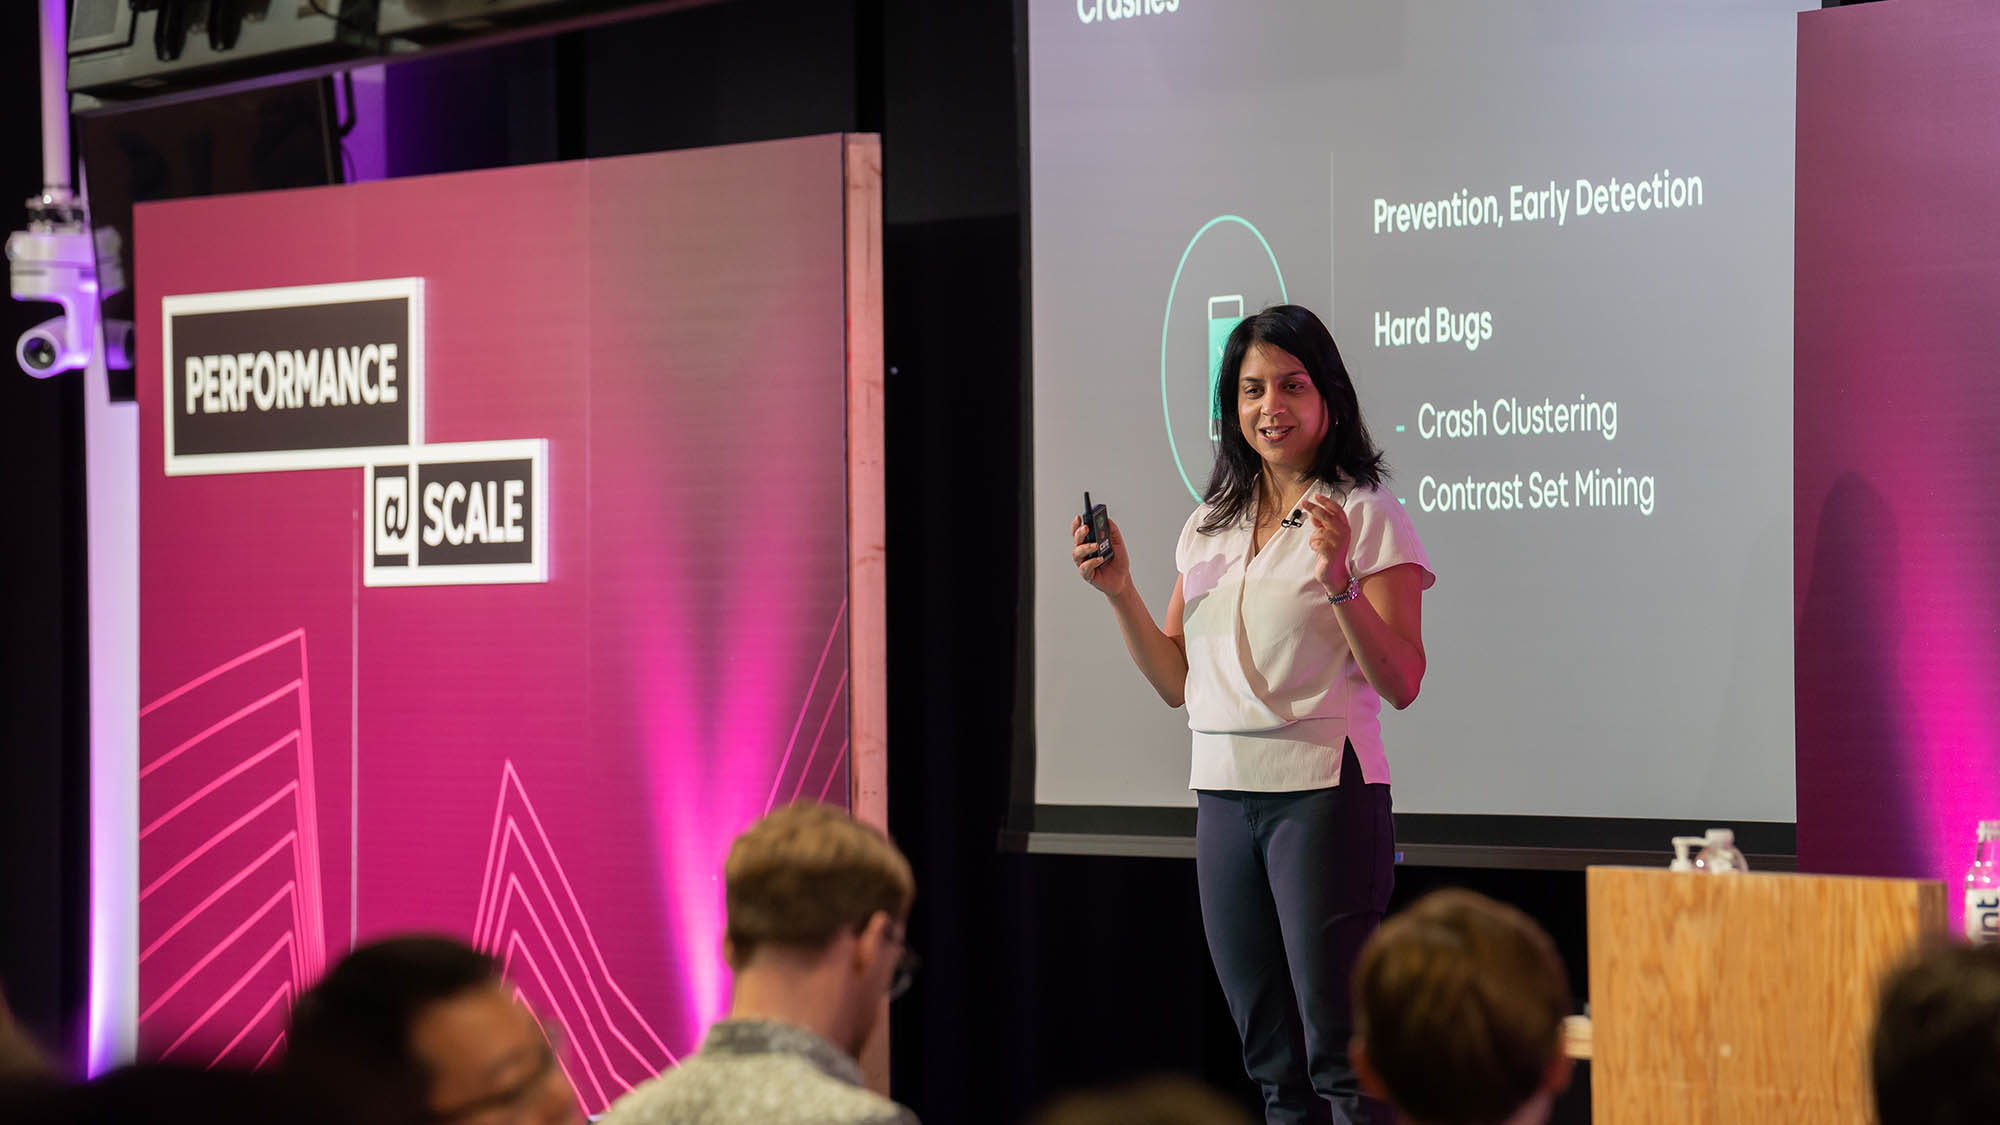
Surupa Biswas, Engineering Director, Facebook
To kick off the event, Surupa takes us through a tour of how performance is done in Facebook’s apps. She describes how product teams and central performance teams work together to improve app size, startup times, crash rates, and more. Through better tools and partnerships, the teams have scaled to more than 150 metrics across multiple apps and platforms.
Performance analysis of Facebook AI workloads on accelerated platforms
Kim Hazelwood, Engineering Manager, Facebook
Kim describes our top-down methodology for uncovering inefficiencies in our production AI workloads, the tools and technologies we’ve built to support performance analysis, and the common pitfalls in optimizing accelerated code. Our tools and techniques are being used by thousands of Facebook engineers on products that serve billions of users.
Scaling machine learning models on Google’s TPUs
Naveen Kumar, Software Engineer, Google
Tensor Processing Units (TPUs) are machine learning (ML) accelerators developed at Google. A TPU v3 Pod offers over 100 PFLOPs of compute, leading to dramatic reductions in training time of ML models. In this talk, Naveen explores some of the scalability challenges, often not unique to TPUs, and techniques to address those challenges.
Scaling deep learning workloads on GPUs
Ujval Kapasi, Senior Director, Software Engineering, NVIDIA
The computational size, complexity, and footprint of neural network training has been doubling about every 3.5 months, according to OpenAI. The amount of data used for training has also been increasing — for instance, as researchers are able to take advantage of unsupervised training methods as in BERT. These researchers now require multiple systems for training their models (a trend similar to scientific simulations on HPC systems in the past). Ujval discusses the techniques needed for running deep learning training at scale on GPUs and achieving state-of-the-art results. He also discusses how to deploy, scale, load balance, and optimize the trained network inference (or prediction) throughput on GPUs, using tools such as TensorRT Inference Server.
The intersection of data, performance, and usability
Sarvesh Nagpal, Bing
Performance is more than a numbers game. This talk shares how Bing leverages behavioral analytics to identify usability bottlenecks and optimize perceived performance. Sarvesh covers a wide range of performance experiments, including good ideas that failed, and summarizes the lessons learned along the way.
Open source browser contributions at Facebook
Vladan Djeric, Software Engineer, Facebook
The web as an application platform is still very much behind native platforms like Android and Windows for performance and richness of integration APIs. This makes it challenging for developers to create sophisticated yet performant web apps, which require a nontrivial amount of client-side JS code. The browser engineering team finds bottlenecks in browser implementations, contributes code to open source browsers, prototypes new web technologies, and advances new API proposals through web standards committees. In this talk, Vladan covers current and future projects for making web apps as fast and as powerful as native apps, including the new isInputPending() API, the upcoming JS Self-Profiling API, and new ideas for eliminating JavaScript overheads.
Facebook’s open source browser contributions
FlameScope: A different way of looking at profilers
Martin Spier, Performance Architect, Netflix
Even under constant load, the behavior of a system is affected by variance, perturbations, single-threaded execution, and other time-based issues—and never completely uniform. Using profilers to analyze the performance of a system generally involves aggregating events or samples over a period of time; identifying these small variations in the full profile becomes a needle-in-a-haystack problem. In this talk, Martin shares how FlameScope solve this by combining a subsecond-offset heatmap, for navigating a profile and visualizing these perturbations, with a flame graph for code-path analysis.
Monitoring real user perceived performance on native apps
Ramya Pasumarti, Staff Software Engineer, LinkedIn
LinkedIn monitors client-side performance of LinkedIn members via a technique known as RUM, or real user monitoring. In this talk, Ramya shares the journey migrating to a new generation of RUM for native apps, challenges faced in building a generic instrumentation framework, trade-offs made to fit in LinkedIn’s mobile architecture, lessons learned, and best practices when designing new Tier 0 performance metrics for the company.
Improving iOS startup performance with binary layout
optimizations
Manman Ren, Software Engineer, Facebook
Shane Nay, Software Engineer, Facebook
Startup of the iOS app is an important performance metric for user experience. However, poor ordering of functions in the iOS binary can greatly increase page faults during startup and significantly hurt startup performance. An “order file” can be used to direct the linker on how to better order functions in an iOS binary. Historically, Facebook has used dtrace to generate an order file for iOS apps, but some apps have multiple startup scenarios that we want to optimize for with the order file. The dtrace approach does not scale well and it is not easy to automate. In this talk, Manman and Shane describe more scalable approaches to generating order files.


