Facebook’s infrastructure consists of millions of hardware components (CPU, memory, drives, etc.) that we monitor frequently to make sure the fleet is working properly. While we have detection and auto-remediation tools like FBAR that can detect issues with an individual server and send it to repair, we also need to handle hardware issues at a global scale. We look at repair history as well, and collect data across longer durations on hardware signals across all machines in our data centers. This generates a lot of data, which we pipe into visualizations and then analyze — and this presents additional challenges at scale. We implemented Hardware Analytics and Lifecycle Optimization (HALO) to put data at our fingertips that we can use to improve global hardware health and future hardware design.
HALO architecture
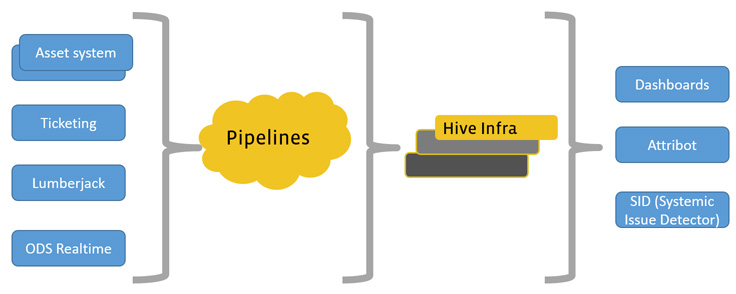
HALO consists of monitoring, data processing, and data visualization components, in addition to a range of alerting and diagnostic tools.

Data monitoring
We need to observe a large number of components with our monitoring infrastructure. We use our own collection tool, Lumberjack, in combination with our asset and ticketing systems and real-time data collection through Facebook’s Operational Data Store (ODS).
Lumberjack
Lumberjack collects a plethora of rich server data at different frequencies. We collect daily logs across the fleet.
Information collected includes SMART attributes for disk drives, flash parameters, RAID controller logs, network interface logs (ethtool), system characteristics, and component logs (iostat, SEL, MCE, CrashDumps). We also collect environmental sensor information (temperature, humidity) and utilization parameters.
We merge data across different time granularities and use Facebook data tools available (such as Scribe and Hive) to process and visualize this rich data set.
Data processing
At a fleet level, we monitor failure rates, error categories, and population statistics. At a high level, this tells us where a failure rate would be unexpected. We also have dashboards for debugging, where we can dig deeper and visually identify correlations and anomalous patterns. We have filters that include the data center locations; the model, manufacturer, application, and characteristics of a particular component that enable us to view information at the fleet level; and groupings of components.
Data visualization and alerting
Dashboards show visual trends and are a useful tool. However, at our operational scale, a large number of components are all sending us rich data throughout the day, resulting in a significant amount of data rows. Plotting aggregate data sets on graphs can reveal higher-level problems, but it becomes too cumbersome to track manually and alert our data center operations or service owners.
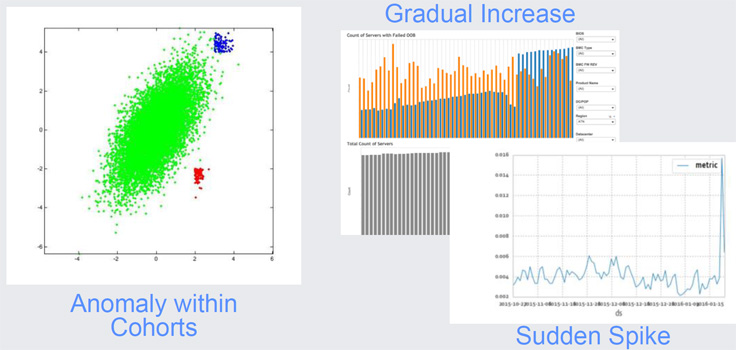
In addition to dashboards, we use anomaly detection automation and alerting. The chart below shows a few interesting areas of anomalies, from gradual increases to sudden spikes. Defining and identifying anomalies requires good knowledge of our hardware systems and correlations of failure conditions to operating conditions. We use data learning tools inside Facebook to automate and alert on hardware anomalies across our fleet.

Attribot
One aspect of our approach is to develop tooling that makes it simple for engineers at Facebook to better understand hardware health. For instance, anyone should be able to run a simple CLI and identify what is wrong with a server. Hardware vendors publish known issues, and we incorporate this information across our hardware generations, servers, and systems software into a tool called Attribot. We also incorporate sustained issues found in the hardware fleet. We have diagnostics that run on servers to identify whether there is a known issue. We have enabled this to be run on a single host or across many hosts.
Systemic Issue Detection (SID)
With any large fleet of servers, hardware eventually fails. One of the important aspects of handling hardware health is to differentiate between normal expected failures and abnormal behavior. This is similar to detecting emerging trends in a market for which we need to allocate resources. We do this programmatically through a system that we call Systemic Issue Detection (SID). SID determines trends across different data centers, different hardware configurations, and different services, and learns when we should be looking at an emerging hardware problem across the fleet. We define thresholds within and across data center regions. The inputs to this system come from the same data pipelines and tables. We use our Attribot to identify known problems with strong signals. We look for as-yet-unknown issues that are increasing in frequency and impacting critical services.
Outcome of HALO
Global Hardware Health
Once we identify an issue through data analysis or alerting, the main focus of our cross-functional team is to remediate the hardware issue. We work with our vendor ecosystem in addition to internal teams to impact hardware health positively. For instance, for hard disk drives, we identified issues related to media and drive quality. These issues drove us to refine manufacturer quality, multi-source our supply chain with high-quality drives, and standardize error reporting for disk drives.
Another example is our work on an out-of-band (OOB) server management mechanism that is used as the final lifeline to manage servers when the regular path to manage them is not functional. We identified firmware issues with our OOB infrastructure and implemented remediations to bring them down across our services and vendors.
With OOB server management and hardware remediations, we are able to work cross-functionally to positively impact hardware health through HALO.
Redesign
The final aspect of increasing hardware health is to bring the lessons learned from HALO into our design process. We have included some of our field experience in our designs, such as our approach to toolless serviceability. We have also changed airflow design based on finding that disk slots at the back of the chassis have more failures than those at the front. We have included dual ROM, based on the upgrading difficulties we experienced with BIOS chips. These examples show our commitment to learning fast and solving issues at design time.
Summary
Sustaining a large hardware fleet is a challenging task and is a responsibility we take seriously. We collect large data sets and use state-of-the-art data techniques to visualize and alert on anomalies. We remediate complex issues with cross-functional teams and learn fast, incorporating our findings into new designs. All of these efforts help us maintain our fleet at high reliability.


