 The basic strategy for all performance and optimization work is the delicious measurement sandwich: measure, change something, then measure again. Detailed network measurements are especially hard to do because we only control one side of the transaction, our own servers. So we design network experiments that are lightweight, continuous, and gather as many samples as possible, even at the expense of detail and accuracy. A billion data points can cover a lot of methodological sins.
Doppler is an internal project for mapping and measuring the network between users and Facebook. The data it collects has many uses, and it’s a good example of how we gather performance statistics at scale. Doppler is not about per-user data, it’s about measuring the internet as a whole as it relates to our servers. [0]
Most Facebook users live thousands of miles away from our servers, so it’s useful to have a good idea about how their network path to us is behaving. If some DNS provider is not doing well in Europe, we want to know that. If some segment of users have low bandwidth or high latency, optimizing for network bytes rather than server CPU is a better use of our time.
Pinging the Vasty Deep
The Doppler probe is a 100-line JavaScript we append to a small random sample of Facebook page hits. The script initiates HTTP requests to some tiny images on our servers and times how long it takes to load them. We perform five to fifty million of these experiments every day. [1]
The first thing we started tracking was end-to-end DNS latency. To do this we set up a wildcard domain that answers to any hostname ending in dns.facebook.com. So you can hit, say, http://xyzzy.dns.facebook.com/favicon.ico and you’ll get an answer back.
Each time the Doppler JavaScript executes, it generates a random hostname prefix, constructs a unique URL, and times how long it takes to load it. Because the hostname and URL are unique, no caches exist anywhere and this experiment (A) encompasses a full end-to-end DNS lookup, then a TCP handshake, and then a minimal HTTP transaction. We then run experiment B, loading a second tiny image from the same hostname [2]. Since the DNS lookup already happened and has been cached by the user’s browser and operating system, experiment B is only a TCP connect and HTTP request.
Subtract B from A, and you get a measurement of the uncached, worst-case, end-to-end DNS latency of the given user. Early on we realized that measurement B by itself is roughly two full round trips over the network [3]. So we divide B by two and use that to track packet RTT between different points on the planet and our data centers. These measurements are not as accurate as you’d get from custom software running on both ends of the transaction, but they work well enough.
The Doppler JavaScript sends these measurements back to our servers via an AJAX request. On the server side we record other bits of metadata like the server name, user IP address, data center, timestamp, and so forth. Over the last year we’ve collected billions of network measurements along a half-dozen interesting dimensions. [4]
By geolocating the user’s IP address and rolling up the records by country and data center, we get a measure of the network RTT and DNS latency from every country to every data center. We use those rollups to draw pretty graphs. When something big happens to the Internet (like undersea cable breaks), it manifests as jumps or dips in the graphs.
Another use of the country-level data is a “pessimizing proxy” called Netlab. From Palo Alto the site loads pretty fast, so our engineers don’t feel what most users feel. With Netlab, we can simulate the Facebook experience of a user in other countries, using real-world numbers for packet latency and bandwidth. [5]
Country data is good for a high-level view. But political borders don’t really match up with the real borders of the Internet. Countries can have many ISPs, and ISPs can span many countries. So we also annotate Doppler logs with the autonomous system number associated with the user’s IP address. An autonomous system is kind of like an independent city-state on the Internet. There are about 35,000 of them, and they represent large networks of computers that are owned or controlled by the same entity. Facebook is an autonomous system, as are Google, large ISPs, carriers, and Harvard University. A packet may pass through many city-states on the way from here to there. If there is a network problem that throws country-level graphs way off, we use this dimension to narrow it down to a specific ISP or network.
We also use Doppler for evaluating TCP optimizations and new network hardware. We take a cluster of servers, apply the configuration or hardware, and watch the graphs to see if anything changes. We also added two more experiments that load images of specific file sizes to measure our users’ effective bandwidth.
Below is a graph of image download times from two of our VIPs. The blue line is the control, with no configuration changes. The yellow line is the experiment, which shows a big improvement:
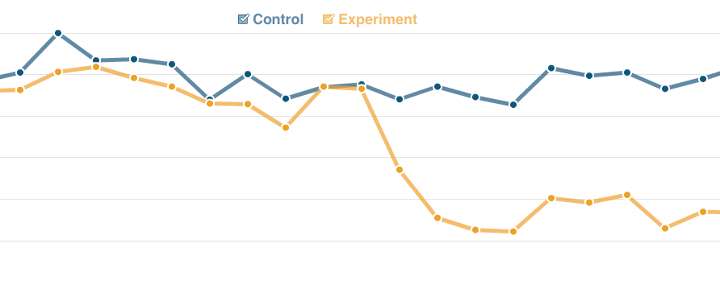
This chart is also an example of why continuous measurements are a good idea. The configuration change was applied a couple of weeks before I heard about it. We could go back and see what effect it had.
Future Work
Recently we added support for mobile users. The measurement probe is written in JavaScript so it works fine on smartphones and a subset of feature phones. Mobile performance in general is in dire need of solid network data, and this is the simplest way to collect it at scale. For the same reason we’ll soon add experiments for SSL and IPv6.
At the moment we are looking at using Doppler data for DNS-based global server load balancing. The basic idea behind global load balancing is that you have one domain name, say www.facebook.com, but many data centers scattered around the world. The DNS load balancers are responsible for returning the address of the data center it thinks is physically closest to the user. The problem is that your DNS server doesn’t talk directly to the user. It talks to intermediary resolvers that query on the user’s behalf. So current systems return the data center physically closest to the resolver. This takes on faith that physical distance is a good substitute for Internet distance, and that the user is reasonably close to the resolver. When either of those assumptions are wrong, we’re giving out the wrong answers.
Every large website has this problem. A while ago Google proposed an extension to the DNS protocol to include part of the user’s IP address in the DNS lookup packet. Having a general idea of the ultimate user’s address would allow DNS load balancers to give out more intelligent answers. But convincing the whole world to adopt your protocol is hard. Fortunately, there is a cheap and cheerful way to do almost the same thing.
Remember that unique hostname, xyzzy? That can also be thought of as a unique ID for a Doppler measurement. Doppler actually results in two server-side logs. The first is the one we’ve been talking about, which contains the measurement ID, user IP, data center, and various measurements. The other comes from our DNS server. Normally, people don’t log DNS traffic but it’s easy enough to do. This second log contains the experiment’s ID paired with the resolver’s IP address.
If you were to join those logs together on the ID, then roll up by data center and resolver IP, you get a direct measurement of Internet latency between your users and your data centers, but indexed by resolver. And that’s what we’re building right now: an alternate map of the world based not on geographic distance, but on pure network latency.
There are probably many more interesting things to do with this kind of data. If you run a website with a decent amount of traffic you can do stuff like this yourself. The important thing when designing your experiment is to keep it continuous, lightweight, and as broad as possible.
Many thanks to Eric Sung, Daniel Peek, Bill Fumerola, and Adam Lazur for their help with this article. Special thanks to Paddy Ganti and Hrishikesh Bhattacharya for their work on Doppler.
Carlos Bueno, an engineer at Facebook, measures twice and cuts once.
Notes
[0] People have been mapping and measuring the Internet since virtually the beginning. One of the earliest Internet mappers was created by Robert Morris in 1988. It exploited software bugs in other systems to self-replicate and report back what it saw. His program itself had a bug, which inadvertently crashed the Internet and introduced the term “computer virus” to popular culture.
A modern (non-destructive) longitudinal study of the Internet is CAIDA run by the Cooperative Association for Internet Data Analysis. They have been collecting data since 1997.
[1] Check out Yahoo’s open source Boomerang measurement library. It includes plugins to measure DNS latency, network latency, bandwidth, and other cool stuff.
[2] It doesn’t actually hit /favicon.ico, it hits an endpoint that returns all of the proper no-cache voodoo and closes the connection. Also, we use multiple domains to test SSL, DNSSEC, IPv6, etc.
[3] There are six packets involved in a minimal TCP handshake and HTTP request. As far as the client is concerned, packet 6 is not part of the timing, and packets 3 and 4 are sent out at the same instant (sometimes as the same packet). So, if you squint hard enough, the time from the sending of packet 1 and the receipt of packet 5 (that is, the time between setting the Image object’s src attribute and its onload event) is equivalent to two network round trips.
1) client SYN
2) server SYN + ACK
3) client ACK
4) client HTTP request
5) server HTTP response + FIN
6) client FIN + ACK
[4] Please note that we average thousands of samples together. Doppler is about gross Internet statistics, not per-user data.
[5] This is done by introducing packet delays and loss at the TCP level. You can do this yourself with Charles Proxy or dummynet. I highly recommend testing your software under high latency and narrow bandwidth.