Overview
In order to adequately forecast compute capacity and financial expense, application developers must benchmark application performance. Three factors are important to consider when analyzing hardware performance: maximum throughput, acquisition cost and operating cost. Industry-standard benchmarks, such as those published by The Standard Performance Evaluation Corporation (SPEC) can be reasonable indicators of maximum throughput for certain workloads. At Facebook, we recognized these benchmarks wouldn’t necessarily represent our application behavior under real-world conditions and developed a proprietary analysis methodology. In this paper, we contrast the conventional wisdom of using industry-standard synthetic benchmarks as guidelines for assessing web application performance with organic traffic measurements performed in a controlled environment. To ensure relevant results, the test environment replicates application-specific architecture and is fed with organic and synthetic workloads. Our observations indicate there are meaningful variances between industry-standard benchmarks and real-world performance of highly scalable applications. This paper outlines the approach and results of testing our application stack on new micro-architectures during the summer of 2009.
Technology Stack
Facebook’s technology stack consists of applications written in many languages, including PHP, C, C++, Erlang and others. For the purposes of this paper, we will focus on evaluating the performance of web nodes running PHP and C++ applications and memcache nodes running a C application. In Facebook’s architecture, web nodes perform the majority of data aggregation and page rendering and are, consequently, the largest portion of our server footprint. Centralizing page rendering in web nodes is necessary to properly overlay social graph relationships and apply privacy constraints.
Test Methodology: Dyno – measuring capacity on the web tier
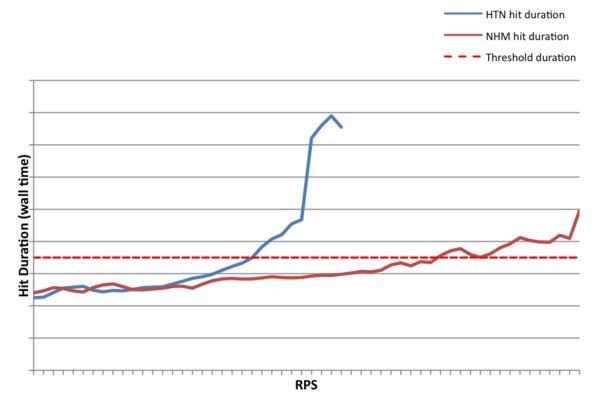
We named our capacity testing process “Dyno” after a dynamometer, a device which measures force or power. Dynos are commonly used to measure engine torque and power as a function of speed (RPM). When tuning a car’s engine for maximum performance, one dyno’s the car to establish a baseline, makes changes to the engine and then dyno’s again to measure the improvement. In our case, we’re observing request duration as a function of throughput or request rate. The request duration is the wall-time recorded in milliseconds to process a query. All requests made to the web nodes are dynamically generated, static content is served separately. A typical request may make hundreds of UDP calls to our memcache tier, a few TCP calls to databases, and possibly a TCP call to a specialized service such as search. If none of those services are overloaded then any increase in request duration as a function of request rate can be attributed to CPU or memory contention.
This contention-induced latency adds time due to oversubscription or resource starvation. Other probable causes for increases in duration are unlikely: physical disk I/O is rare, the network link is at a low utilization, and any mutex locks for shared memory access have been scaled properly. We defined 100ms of contention-induced latency per request as the threshold for 100% utilization. At latency increases higher than 100ms interacting with Facebook is noticeably slower. By observing the average request duration under a moderate request rate and then increasing the request rate until latency increases beyond 100ms, we can determine the maximum request throughput of the server and the request rate which corresponds to 100ms of contention-induced latency.
The efficiency of the web node is a function of the entire stack: the hardware, the kernel, low-level libraries, the web server, and PHP code. To measure potential improvements in hardware or software, we allocate a control group of servers using our current stack and a test group where we’ve changed only the component containing the potential improvement. We then simultaneously route production traffic with the same request profile against each set of servers. By adjusting the traffic from a low request rate to a high rate, we can collect a dataset that clearly demonstrates the request throughput delta between the control and test groups. Because the average request duration can be unpredictable, we also monitor the average time a request spends waiting in the kernel’s run queue. That wait time in the run queue is a direct measurement (in microseconds) of the amount of time a hit is delayed due to CPU and memory contention.[1] Using tens of servers over a few hours we obtain a measurement precision of less than 1%. After testing several generations of processors and micro-architectures, we determined that the most significant limiting factor of request throughput is typically memory access contention. On web nodes, our application typically allocates 25MB per request. When we compare several generations of processors under high load, we see dramatic gains in the maximum throughput of the node when the hardware has a more advanced memory architecture.
System Configuration
As noted previously, Facebook measures throughput of a web node in requests per second (RPS) as an indicator of performance and capacity. Anecdotally, when Facebook switched from an FB-DIMM platform to the Intel San Clemente platform, utilizing DDR2 memory, we observed an unexpected increase in throughput. This performance boost initiated an investigation that found the web application to be memory- and CPU-bound. The decreased latency of the DDR2 architecture provided a significant increase in web node throughput. Based on the performance improvement observed with the DDR2 platform, we anticipated another increase in web request throughput with the release of the Intel Nehalem/Tylersburg architecture. The most interesting aspects of the Nehalem/Tylersburg architecture are the integration of a memory controller on the CPU, increased memory speed from DDR2-667 to DDR3-1066, and QuickPath Interconnect (QPI) providing low-latency, high-bandwidth access to memory.
With respect to the Facebook web application, memory access latency is a significant factor in overall throughput. The implications of Intel’s evolution from a relatively large per-core L2 cache to a shared L3 cache with the Nehalem architecture are still being investigated. We’re continuing to study utilization and performance trade-offs of our applications with the new cache architecture.
To determine the performance delta between Harpertown and Nehalem, we performed multiple runs using the Dyno system with one type of production workload on a Harpertown/San Clemente-based node and an equivalently configured Nehalem/Tylersburg node. The nodes being tested were configured with CentOS 5, a kernel with internally developed modifications and the Facebook application stack. Performance governors were disabled during the testing to eliminate dynamic clock changes on the CPU and guarantee the highest performance. The hardware configurations consisted of the following components: System A (Harpertown/San Clemente): • 2x Intel L5420 2.5GHz CPU • 2x 4GB DDR2 DIMM 667MHz • 1x 7200RPM SATA HDD System B (Nehalem/Tylersburg): • 2x Intel L5520 2.26GHz CPU • 6x 2GB DDR3 DIMM 1066MHz • 1x 7200RPM SATA HDD The scope of this paper is limited to comparing the two most recent Intel platforms with a concentration on the benefits of the Nehalem/Tylersburg platform over the previous generation.
Regardless of the information provided here, we continually benchmark the performance of various CPU micro-architectures to understand application performance on each node type. Specifically, AMD’s Istanbul architecture presents several interesting benefits and drawbacks that are being analyzed.
Industry-Standard Benchmark Results
As a reference, Intel has published the following data for industry-standard benchmark tests[2]: SPECWeb*2005 — 154% better SPECjAppServer*2004 — 93% better SPECjbb*2005 — 64% better SPECpower*ssj2008 — 74% better
Test Execution
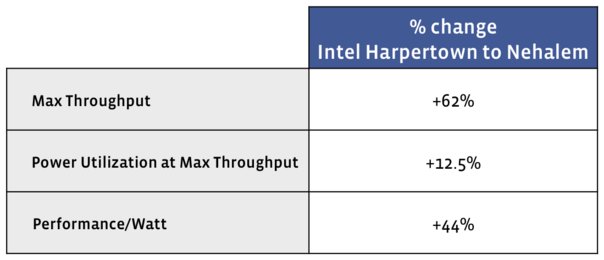
Using the guideline of maximum acceptable throughput being equal to an additional 100ms of request duration compared to a baseline measurement, the Nehalem/Tylersburg node delivered a 62% increase in RPS compared with the Harpertown/San Clemente node (see Figure 1). These results are similar to a SPECjbb*2005 report issued by Intel demonstrating a 64% improvement between these platforms. This isn’t entirely surprising considering the similarities of Facebook’s application architecture and the three-tier client/server stack emulated by SPECjbb*2005. We intend to continue tracking the SPECjbb*2005 performance benchmark relative to observed Dyno performance in order to understand whether this was a singular correlation or consistent across micro-architecture generations.
Anecdotally, we noted with HyperThreading (HT) disabled we were only able to achieve a 40% improvement in RPS over Harpertown/San Clemente. Since we maintain thousands of servers across multiple datacenter environments, we’re concerned with the performance and power for the entire fleet, not only a single node. Any performance changes as a result of server architecture must be correlated with power utilization metrics to form a holistic view of how a node will perform in a fleet. Performance per watt is a means to determine cluster capacity within a datacenter which generally has a fixed amount of power. The performance per watt calculation is: Max Throughput / Power consumption under load Using the performance per watt calculation, the Nehalem/Tylersburg platform performed 44% better compared to Harpertown/San Clemente.
Understanding performance per watt drove the decision to standardize on the low-voltage “L” series CPU rather than the highest clocked “E” series CPU. We considered the 20W power delta per CPU to be of greater benefit than the incremental speed bump of 270MHz in a scaled out environment. Furthermore, as Nehalem/Tylersburg is relatively early in its lifecycle, we expect continued advancements in power utilization from on-going optimizations.
Conclusions
Our performance testing illustrates that while industry-standard benchmarks are reasonable mile markers, it is imperative that application developers carefully profile changes to underlying hardware and software. Simulating web load by replaying historical transactions or log data is a common method to achieve consistent test results. At Facebook, we went a step further and built Dyno, which provides fine-grained control over request rate and request type under test. Our investigation revealed the maximum request throughput of Facebook’s applications on Intel’s Nehalem micro-architecture increased by 62% compared to Harpertown. The performance-per-watt difference between Nehalem and Harpertown — a more comprehensive and accurate representation of the entire TCO delta — measured 44%. Beyond raw performance, system power is an important component in overall server TCO. x86-based servers do not draw energy proportional to the work performed, today’s conventional servers have a high idle power draw which increases moderately as load increases on the server[3]. To advance the industry, we advocate application developers and server operators understand the relative cost components of their respective infrastructure and strive to accurately profile workloads prior to evaluating new technologies.
References
[1] The linux kernel provides a per-process statistics interface called taskstats which we use to monitor time spent in the run queue. [2] Intel Server Performance Summary of the Xeon Processor Family, http://www.intel.com/performance/server/xeon/summary.htm?iid=perf_server+dp_sum [3] The Case for Energy-Proportional Computing, http://www.cra.org/ccc/docs/ieee_computer07.pdf